Chart of the Day: This Magnificent Seven Chart Is Very Intriguing
The stock continues to move upward in the face of regulatory issues.
You've reached your free article limit
You've read 0 of 1 free Pro articles.
One thing to know about a stock like Alphabet/Google GOOGL is that a large buyback can provide good support at a time in need.
Alphabet stock had been under assault by the sellers after reaching new all-time highs in early July. The stock fell a massive 23% from peak to trough in two months, shedding billions in market cap. But in early September the selling abated, as the company likely did some buying of that massive 75 billion dollar buyback plan announced in April 2024.
Today, the company faces severe scrutiny over their market dominance in search and other areas of their business, but the stock chart shows us a company that is improving its posture.
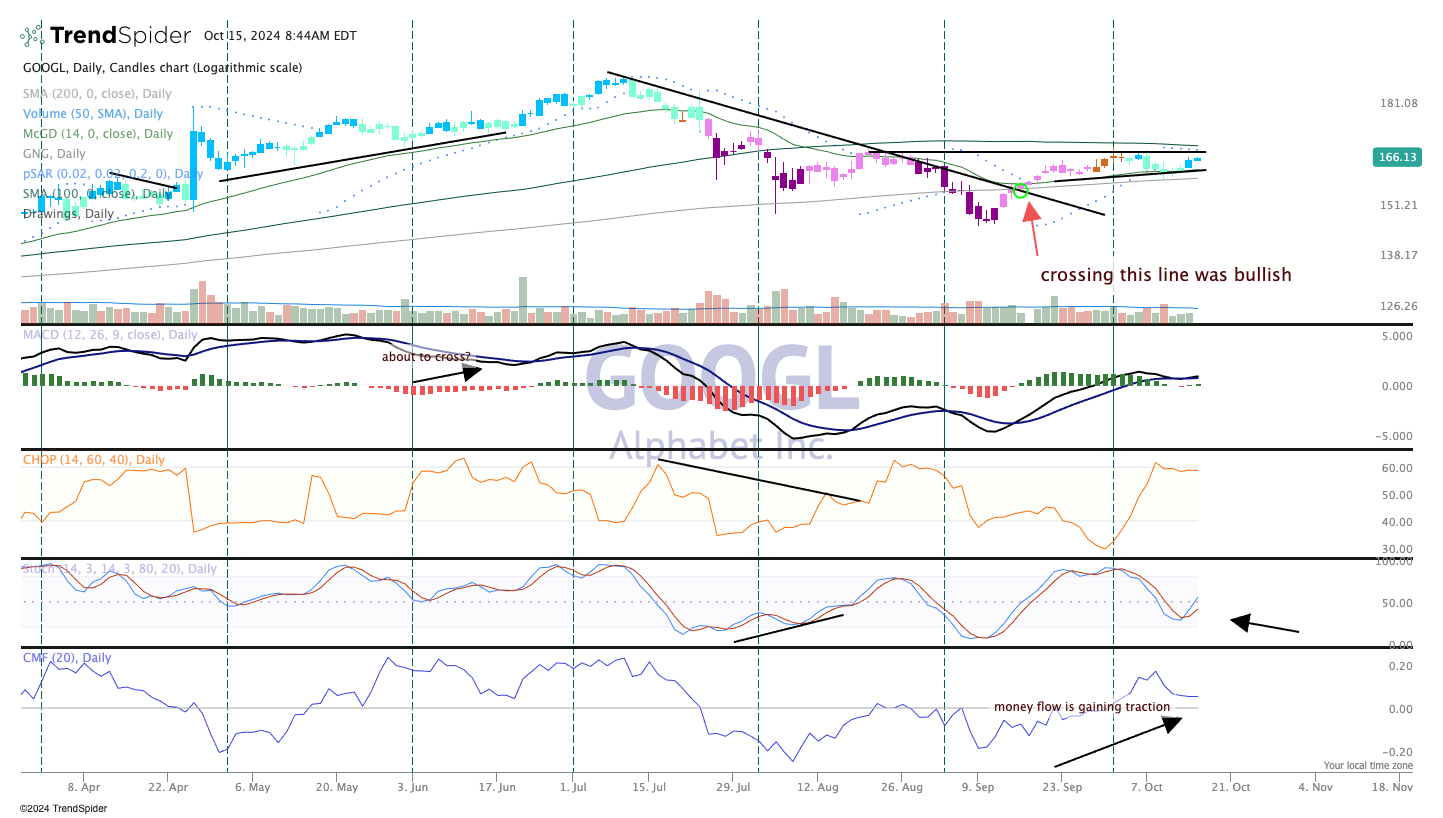
The indicators are much improved from a month ago, and money flow at the bottom is showing bullish strength as the Chaikin money flow pushes into positive territory. Momentum remains strong, the stochastics have turned up while the Moving Average Convergence Divergence (MACD) is crossed over for a buy signal.
Importantly, the candles are blue, which is strongly bullish on the GoNoGo composite of indicators. We also see the formation of a bullish inverse head/shoulders pattern. A move above the 200-day moving average would launch this stock back towards the $195 level.
We rate Alphabet a One in TheStreet Pro Portfolio.
More Pro Portfolio:
- Why We Opened a Position in a $8.4 Billion AI Name
- Weekly Roundup: Portfolio Begins October With Big Gains and Big Moves
- We Did the Homework for You: Here're the Top Stories on Our Investing Themes
At the time of publication, TheStreet Pro Portfolio was long GOOGL.
