Weekly Roundup: Tariff Repercussions Roil the Market With More Uncertainty Ahead
We will continue to pick our spots as we monitor market technicals and upcoming earnings. Here's what we're watching for now.
You've reached your free article limit
You've read 0 of 1 free Pro articles.
Simply put, the stock market faced painful back-to-back trading days following President Trump's unveiling of his math-wonky reciprocal tariffs on Wednesday. In some respects, the tariffs were more than those hinted at by the president leading up to the formal announcement, and they also included his previously announced auto tariffs.
When the market opened on Thursday, it moved briskly lower, but developments on Friday accelerated the selloff as we closed out the week. Those developments were China announcing incremental 34% tariffs on U.S. imports, a much stronger than expected March Employment Report, and very sobering comments from Fed Chair Powell about rate-cut prospects.
All told, the S&P 500 shed just over 9% for the week, while the Nasdaq Composite fell 10%. The impact of those moves has both market barometers oversold, with the S&P’s relative strength level at 23.25 and the Nasdaq’s finishing the week at 24.49. Meanwhile, the Cboe Volatility Index spiked to close Friday in the mid-40s, downside volume in the market moved past 90% (a key indicator for Helene Meisler), and the McClellan Oscillator indicated the market is modestly oversold, but with room to move even lower.
To say the least, it's very tempting to put some cash to work, but as we saw Friday afternoon when Powell removed the rate-cut punch bowl, unexpected developments have the potential to drive it lower. As we look to the weekend, several potential fresh developments could continue the market selloff. These include potential additional retaliatory tariffs on the U.S., President Trump escalating tariffs on China and others, and companies pre-announcing quarterly results as they bake what is known so far about tariffs into their June-quarter guidance.
While we watch for those and other possible events that could shape the start of market trading next week, we will also be on the lookout for those that could help stocks find their footing and claw back some of this week’s losses. The likely candidate for that would be Trump announcing trade deals, but, in our view, the market would need to see the rollback of Trump’s “reciprocal” tariffs to reduce the levels of uncertainty and anxiety in the market.
While that could happen, it’s likely to take time. Given the April 9 start for Trump's reciprocal tariffs and the April 10 one for China’s incremental retaliatory tariffs, we’ll be monitoring developments for signs of a potential deal or if further tariff escalation is likely. The former, subject to the actual terms, would help the market rebound but the latter would likely keep pressure on the market.
The message is that while the stock market sold off hard this week, the forward-looking hurdles we’ve been discussing with you remain. As we saw on Friday, rather than act prematurely the prudent move was to stay on the sidelines following Thursday’s selloff. The weekend’s developments as well as those early Monday morning, or potentially the lack of any, will dictate how we begin next week.
The key for us to start deploying capital will be having a greater degree of confidence that the worst of tariff-related pain is behind us. As we discuss below in "The Week Ahead," with little to no meaningful changes to 2025 consensus S&P 500 EPS figures in the last few days, that confidence may not arrive as early as the start of next week. However, we will continue to look for well-positioned and well-priced opportunities that mesh with the portfolio’s longer-term time horizon both in our current holdings and outside of them.
Catching Up on the Portfolio This Week
There is no way to sugarcoat it, this week was a tough one for the S&P 500 and the Nasdaq Composite, making it a challenging one for the TheStreet Pro Portfolio despite our moves last week and early this week that significantly increased our cash position.
Following the exit of Lockheed Martin LMT and Mastercard MA last week, the combination of pending auto tariffs and concerns over what President Trump could announce on April 2, led us to shed the portfolio’s position in Applied Materials AMAT on Monday, March 31. In 2024, China accounted for 37% of Applied’s revenue and the decision to close out the position ahead of Trump’s reciprocal tariff announcement and China’s retaliatory tariffs announced on Friday limited the position’s drag on the portfolio.
The portfolio’s cash position moved up another few notches after closing out AMAT, and paired with our inverse ETF holdings, our defensive positioning sits at roughly 20% of assets. While the market sold off hard on Thursday and Friday, pushing the S&P and Nasdaq well into oversold territory, given potential weekend developments we will continue to proceed with caution.
Even though we are walking the prudent path, we will be working over the weekend so, if need be, we can hit the ground running on Monday. That means evaluating some new candidates for the Bullpen and also refining potential pick-up points for our current holdings. As we make those refinements, one of the factors we’ll be considering is their RSI levels and where they stood when the market wrapped up trading for this week:
Apple AAPL: 25.19
Amazon AMZN: 27.19
Axon Enterprise AXON: 38.24
American Express AXP: 26.96
Bank of America BAC: 21.16
Dutch Bros BROS: 30.46
First Trust Nasdaq Cybersecurity CIBR: 28.54
Costco Wholesale COST: 40.65
Elastic NV ESTC: 28.62
Eaton Corp. ETN: 30.29
Alphabet GOOGL: 28.05
Labcorp. LH: 31.67
Meta Platforms META: 25.77
Marvell Technology MRVL: 21.78
Morgan Stanley MS: 27.66
Microsoft MSFT: 29.89
VanEck Uranium & Nuclear ETF NLR: 28.01
ServiceNow NOW: 28.69
Nvidia NVDA: 28.46
Universal Display OLED: 21.75
Palantir Technologies PLTR: 36.63
ProShares Short QQQ PSQ: 76.91
Qualcomm QCOM: 20.84
ProShares Short S&P500 SH: 78.08
United Rentals URI: 32.65
Vulcan Materials VMC: 41.01
Waste Management WM: 45.63
Now let’s see what Wall Street had to say about the portfolio’s holdings this week:
Bank of America reduced its Apple target to $250 from $265. Its Buy rating remained as it expects Apple to minimize the impact of tariffs by flexing its formidable supply chain. By comparison, Tigress Financial upped its AAPL target to $300 from $295 calling out Apple’s Services growth. We have discussed the positive margin mix shift associated with the Services business, especially during quarters characterized by lower iPhone volumes.
Truist lowered its price target for Bank of America to $50 from $53 but kept its Buy rating on the shares.
Guggenheim upped its Dutch Bros target to $72 from $54. It’s a bit of a catch-up call following the company’s Investor Day last week.
Barclays trimmed its Eaton price target to $306 from $315.
Redburn Atlantic initiated coverage on Labcorp shares with a Buy rating and a $276 target.
JPMorgan reduced its price target for Morgan Stanley shares to $125 from $129 due in part we suspect to prospects for a slower-than-expected IPO market. BofA dialed its MS price target back to $144 from $150 sharing it expects a cautious tone when the firm reports its quarterly results next week.
Loop Capital lowered its Vulcan Materials price target by $5 to $320. In last week’s Monthly Roundup, we discussed how the company’s March quarter will likely be impacted by winter weather. We see that activity rebounding as we move into the spring and summer months and construction megaprojects and infrastructure ones proceed.
This Week's Portfolio Videos
We cover a lot of ground during the week in our Daily Rundowns. If you happened to miss one or more of them, here are some helpful links:
Monday, March 31: We’re Selling Out of This Name Ahead of 'Liberation Day'
Tuesday, April 1: What Tuesday’s Economic Data Means for the Portfolio and These 4 Positions
Wednesday, April 2: Top defensive stock picks as tariffs, market uncertainty loom
Wednesday, April 2:
Wednesday, April 2: NewsMax, Trump & DJT, Visa's offer to Apple: Trending Tickers
Wednesday, April 2: Farmers expect to see 'very rough year' for net farm income
Wednesday, April 2: The importance of owning retail stocks with 'bargaining leverage'
Wednesday, April 2: Q1 ETF flows show shift to risk-off investing as tariffs loom
Thursday, April 3: Why We’re Watching These Indicators and RSI Levels
Friday, April 4: Powell Quickly Removes the Rate-Cut Punch Bowl
Key Global Economic Readings
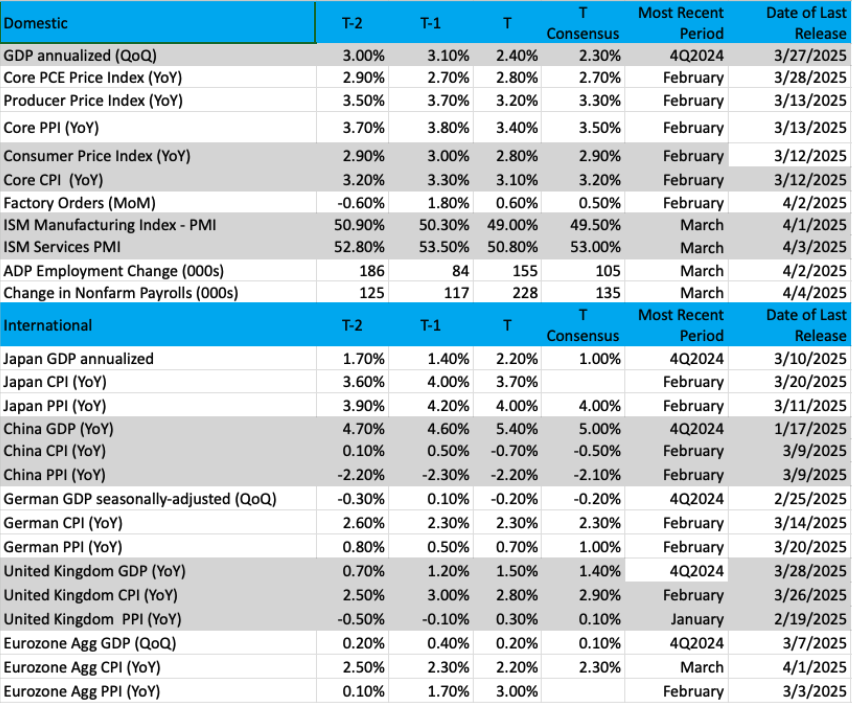
(Note: T is the most recent period, T-1 is the prior period's reading and T-2 is two periods back, the intent being to illustrate any trends)
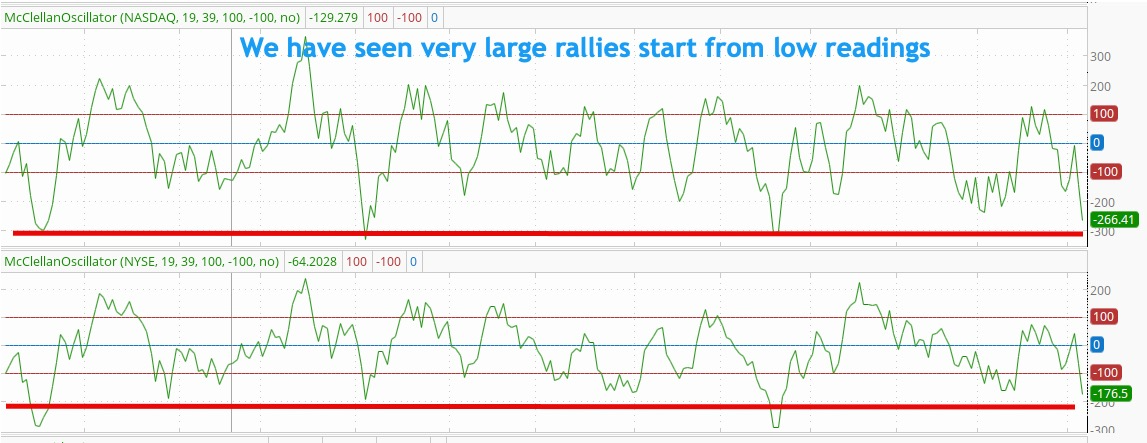
Chart of the Week: The McClellan Oscillator
Breadth is a great way to determine the health of the stock market away from the price and volume action. A different view often gives us better information to analyze and thus make decisions. Sometimes the price action does not explain everything that is going on under the hood, but breadth is an excellent tool to see what is happening.
While there are several different breadth indicators out there, they mostly give us the same result as the data are the same. But the classic McClellan Oscillator is one we like to examine regularly as we can easily graph out the data and make very easy interpretations.
The indicator was created in the 1960s by Sherman and Marian McClellan to find differentials in advancers vs. decliners and to create a summation of the daily result. The figures that were seen at extremes (overbought, oversold) created some amazing opportunities to trade against the tide, reversal conditions that were destined to win as the bias was tilted in one direction or the other. In other words, too much bullishness required a bet to the downside, and vice versa.
Through it all, the summation index was derived by adding each day's McClellan Oscillator reading to the previous day’s summation index. Simplified, when above zero this indicator is considered bullish, but when below zero it is considered bearish. A rising trend is also bullish.
So, where are the oscillators today?
After the markets have been shaken down this week you can imagine they would be very negative, and that would be correct. We find when the NYSE is at –250 or so it is an extreme oversold, and when the Nasdaq is at -300 or so then a reversal is likely. The "lower" these readings go and the longer they stay, the more powerful the rally will be eventually, but perhaps only to resistance. In other words, don’t trust a snapback rally to last for too long.
The extreme readings could be soon, but we are NOT there yet. The symbols we use for the oscillators (on stockcharts.com) are $NYMOT and $NAMOT.
Other charts we shared with you this week were:
Monday, March 31: S&P 500 - The S&P Is Heading Down a Dark Road
Monday, March 31: Qualcomm (QCOM) - A Curious Clue for Qualcomm
Tuesday, April 1: Uranium Nuclear Energy ETF (NLR) - A Nice Run Right Up to a Decision Point
Wednesday, April 2: DR Horton (DHI) - This Bullpen Name Is Worth Watching
Thursday, April 3: Vulcan Materials (VMC) - Bouncing Around Following a Steep Drop
The Week Ahead
As we fade into the weekend, we will remain on high alert for developments that could determine how we begin the first full week of trading in April and the start of the March-quarter earnings season. These include word of other retaliatory tariffs in response to the Trump “reciprocal” tariffs announced Wednesday afternoon as well as any incremental tariffs announced by the president. The two we are watching for are reciprocal tariffs by the European Union on U.S services, and Trump escalating tariffs on China after it hit back with tariffs of 34% on all U.S. good, which are in addition to previously imposed tariffs.
Because companies have a somewhat better handle on the tariff landscape, we will also be on the lookout for earnings pre-announcements. Despite all the headlines on tariffs, we haven’t heard much from companies as yet. That’s likely because they are in their quiet periods that precede announcing their quarterly results, tabulating their results but also casting and re-casting their forward guidance based on this week’s developments.
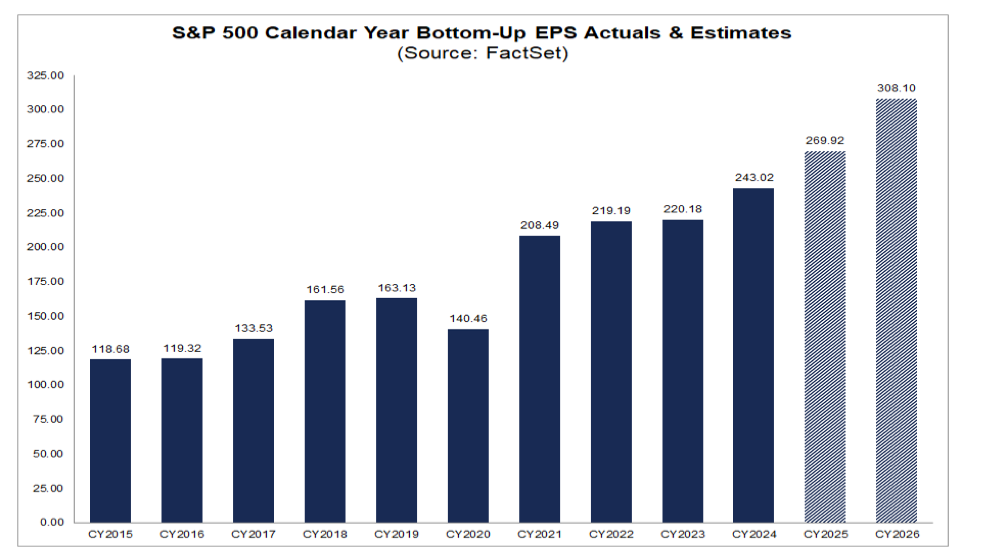
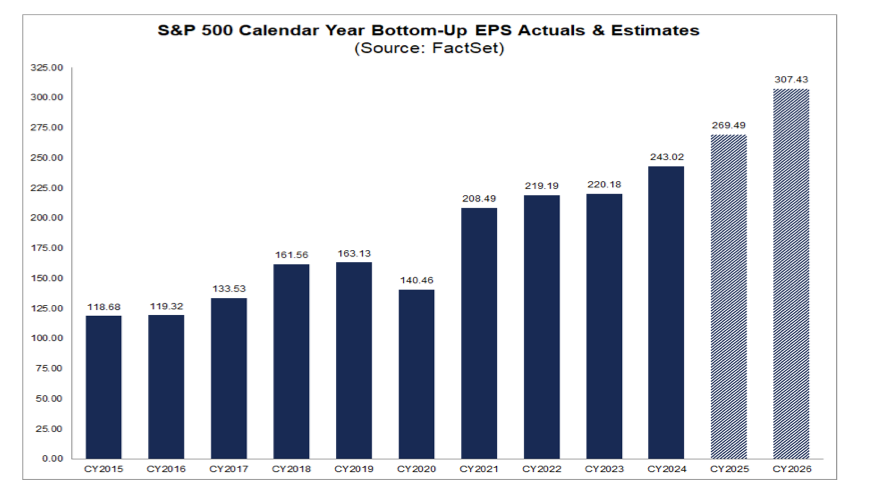
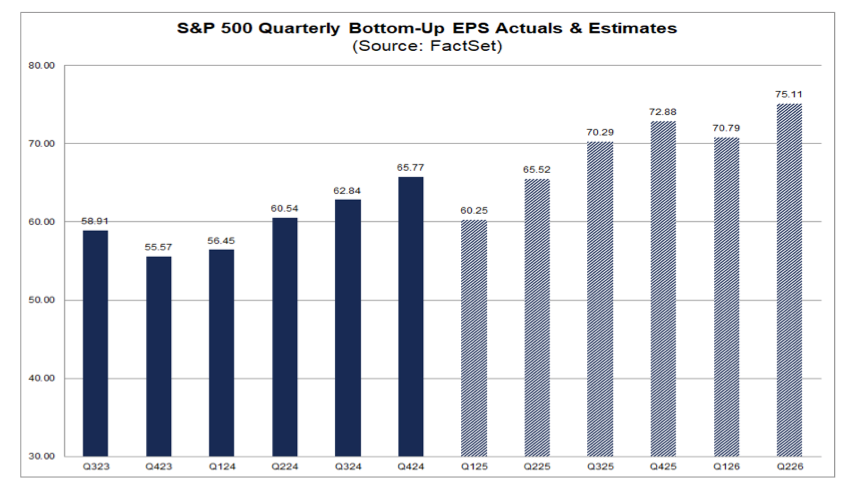
We also haven’t seen much movement yet for Wall Street’s 2025 S&P 500 consensus EPS figure. Exiting March that figure stood at $269.92 but with this week’s update from FactSet, it still stands at $269.49. June-quarter earnings for that market basket are still expected to rise more than 8.7% compared to the March quarter with further gains in the back half of the year. Considering the developments that have been announced and the starting point for those tariffs, both EPS figures seem more than a wee bit optimistic. That’s another reason for us to brace for earnings pre-announcements over the weekend and next week.
In terms of the economic data coming next week, the four items we will be focusing on will be the March NFIB Small Business Optimism Index, the Fed’s latest FOMC meeting minutes, and the March CPI and March PPI reports. In the latest data from the NFIB, we’ll be examining what is shared about inflation and hiring, but the updated look at the Uncertainty Index will also be of interest. Given Fed Chair Powell’s comments on Friday and other recent ones from various Fed officials, the FOMC meeting minutes aren’t likely to be market-moving, but it always pays to understand the larger conversation about Fed policy decisions.
Based on what we saw in the March PMI data from ISM, we are not expecting any meaningful improvement in the March CPI or PPI data. Granted, we’ve seen commodity prices fall in the last few days but that won’t be captured until the April data, assuming those moves are sustained over the next few weeks. Here, too, Powell’s Friday comments that “Looking ahead, higher tariffs will be working their way through our economy and are likely to raise inflation in coming quarters...” suggest the market will digest those March inflation reports but focus more on the data in April and upcoming months.
Here's a closer look at the economic data coming at us next week:
U.S.
Monday, April 7
· Consumer Credit – February (3 PM ET)
Tuesday, April 8
· NFIB Small Business Optimism Index – March (6:00 AM ET)
Wednesday, April 9
· MBA Mortgage Applications Index – Weekly (7:00 AM ET)
· Wholesale Inventories – February (10:00 AM ET)
· EIA Crude Oil Inventories – Weekly (10:30 AM ET)
· FOMC Meeting Minutes (2 PM ET)
Thursday, April 10
· Initial & Continuing Jobless Claims – Weekly (8:30 AM ET)
· Consumer Price Index – March (8:30 AM ET)
· EIA Natural Gas Inventories – Weekly (10:30 AM ET)
· Treasury Budget - March (2 PM ET)
Friday, April 11
· Producer Price Index – March (8:30 AM ET)
· University of Michigan Consumer Sentiment Index (Prelim) – April (10:00 AM ET)
International
Monday, April 7
· Japan: Leading Economic Index – February
· Germany: Industrial Production – February
· Eurozone: Retail Sales - February
Tuesday, April 8
· China: Foreign Exchange Reserves – March
· Japan: Eco Watchers Survey - March
Wednesday, April 9
· Japan: Machine Tool Orders, Consumer Confidence - March
Thursday, April 10
· Japan: Producer Price Index – March
· China: Inflation Rate - March
Friday, April 11
· Germany: Inflation Rate (Final) – March
· UK: GDP, Industrial Production - February
We will be paying close attention to earnings pre-announcements, connecting the dots back to the portfolio’s holdings as well as their customers, competitors, and suppliers. We’ll be doing similar work with those companies that are reporting, focusing on what is said about consumer spending, margin pressure, and of course how tariffs are expected to impact their business and bottom-line results.
Based on published earnings data calendars, we expect Morgan Stanley MS will report Friday morning and based on reports Friday that Klarna, StubHub, and Chime have delayed their IPOs given the current market environment, we are not expecting Morgan to deliver an upside surprise with its guidance. Trading volume, however, is likely to be a favorable factor. As we digest that report, will be contrasting it with what we learn from JPMorgan, Wells Fargo, and other banks set to report results the following week.
Here's a closer look at the earnings reports coming at us next week:
Monday, April 7
· Close: Dave & Buster’s (PLAY), Levi Strauss (LEVI)
Tuesday, April 8
· Open: WD-40 (WDFC)
· Close: Cal-Maine Foods (CALM)
Wednesday, April 9
· Open: Delta Air Lines (DAL), Simply Good Foods (SMPL)
· Close: Constellation Brands (STZ), PriceSmart (PSMT)
Thursday, April 10
· Open: CarMax (KMX)
Friday, April 11
· Open: BlackRock (BLK), BNY Mellon (BK), Fastenal (FAST), JPMorgan (JPM), Morgan Stanley (MS), Wells Fargo (WFC)
Portfolio Investor Resource Guide
· Economic Data: Here's a List of Links to the Key Economic Data We Closely Watch
· Investing Terminology: 16 Key Terms Club Members Should Know
· 10-Ks: Want to Know About a Stock? Read the Company's Reports
· 10-Qs: Unlock the Numbers and Key Information Behind Your Stock With the 10-Q
· Income Statement: Our Cheat Sheet to Understanding This Financial Document
· Balance Sheet, Cash Flow Statements, and Dividends: How to Know If a Company Is Off-Kilter? Read Its Balance Sheet
· Valuation Metrics: Everyone Wants a Value. Here's How Investors Can Find
· Thematic Investing 101 Webinar
The Portfolio Ratings System
1 - Buy Now (BN): Stocks that look compelling to buy right now.
2 - Stockpile (SP): Positions we would add to on pullbacks or a successful test of technical support levels.
3 - Holding Pattern (HP): Stocks we are holding as we wait for a fresh catalyst to make our next move.
4 - Sell (S): Positions we intend to exit.

