Charting the Markets: Powerful Reversal Will Lift S&P 500 to New All-time High
A recent intraday move was stunning and full of bullish qualities.
You've reached your free article limit
You've read 0 of 1 free Pro articles.
The S&P 500 chart shows the index made a stand at 5,400 this past week, which was just above the lows from the prior week.
Wednesday was a fascinating session, with market falling sharply by midday, nearly a 2% drop on pretty heavy turnover back towards that 5,400 level but then made an abrupt U-turn higher. In the end, the S&P 500 closed at session highs, about 150 points above the lows of the day.
That was some reversal, with the bulls taking the reins after it appeared the bear would try and push the markets lower. What followed that drop was stunning, but even more important was a followthrough day on Thursday and Friday.
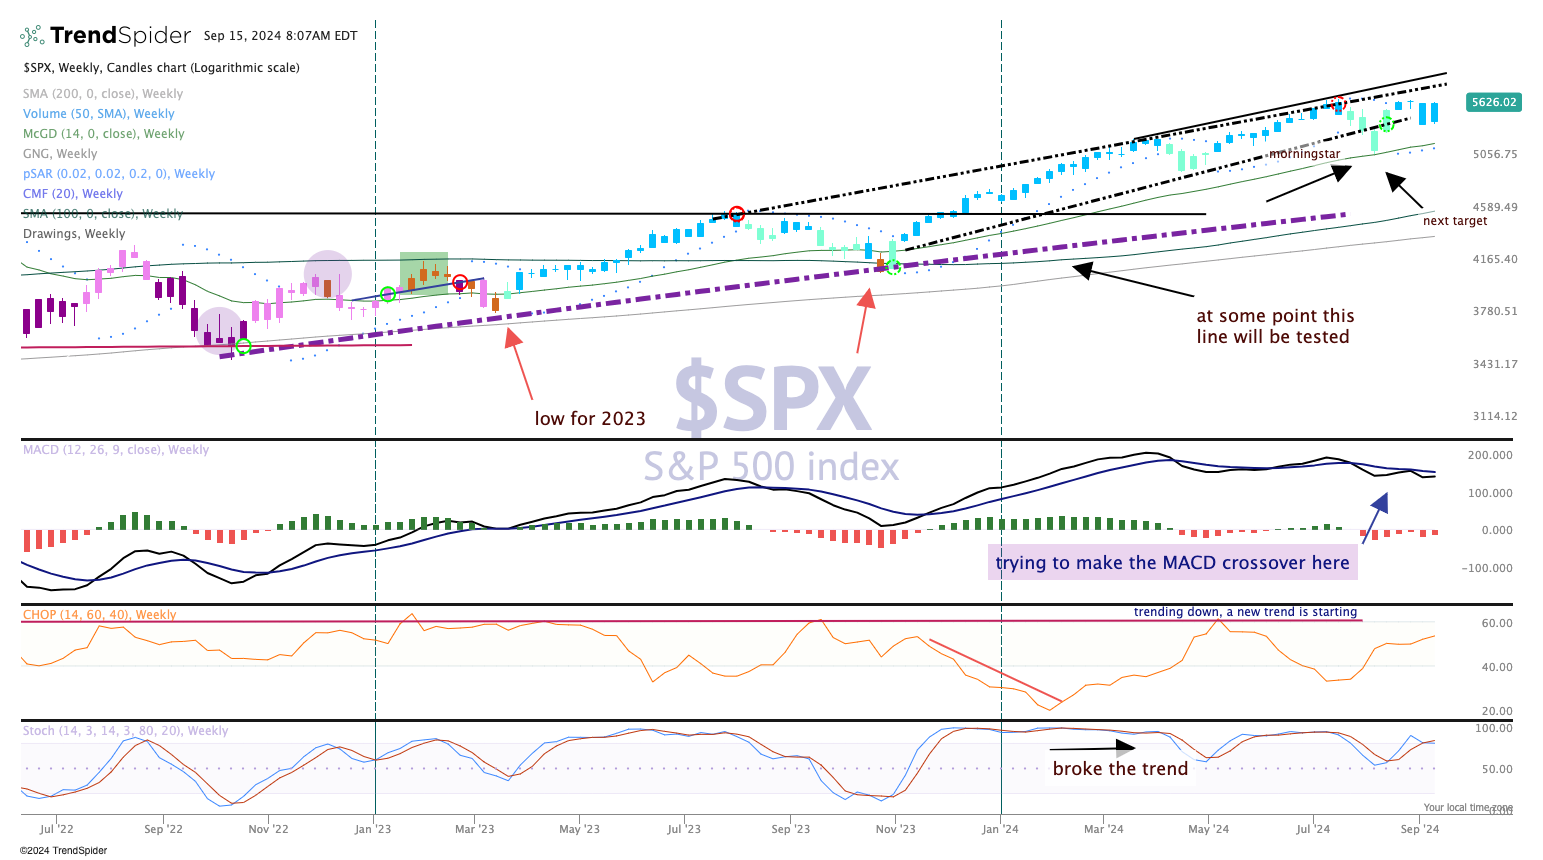
What does it all mean? Basically the floor has been established, mentioned above at 5,400 and higher levels can be targeted. First up are the all-time highs, which is less than 1% away from current levels — the market is not overbought here just yet. However, the wildcard here could be the Fed meeting and if Chair Powell throws cold water on expected rate cuts (the fed funds futures see four-and-a-half cuts in 2024, more than the committee has talked about).
Some targets to consider if a breakout continues include 5,700 then 5,850 which would be the top of the two ranges drawn. We changed the top band (dotted) to include the interim top of July 2023.
