Chart of the Day: It's the Most Amazon Time of the Year
The stock has pulled back and is now giving a nice entry point.
You've reached your free article limit
You've read 0 of 1 free Pro articles.
The time has come for Amazon (AMZN) to separate from the rest of the pack. Now, you may be wondering if we are talking the retail side of the business, and that would be partially true. The holiday season is here and starting this weekend (November 29, Black Friday) the registers at Amazon will be ringing loud and often.
With recent retail trends on the upswing, consumer confidence strong and a renewed spirit of Americans feeling better this could be a record-breaking holiday shopping season. To be certain, many experts in retail believe cyber (online) shopping will grow double digits and set records.
But let's not forget the real power that drives Amazon's growth engine: AWS. This story is yet to play out, and the lead Amazon has over its competitors is slim but worthy of a lofty multiple for the stock. By some measures, Amazon trades at a discount to its competitors in this area, so there is room to grow.
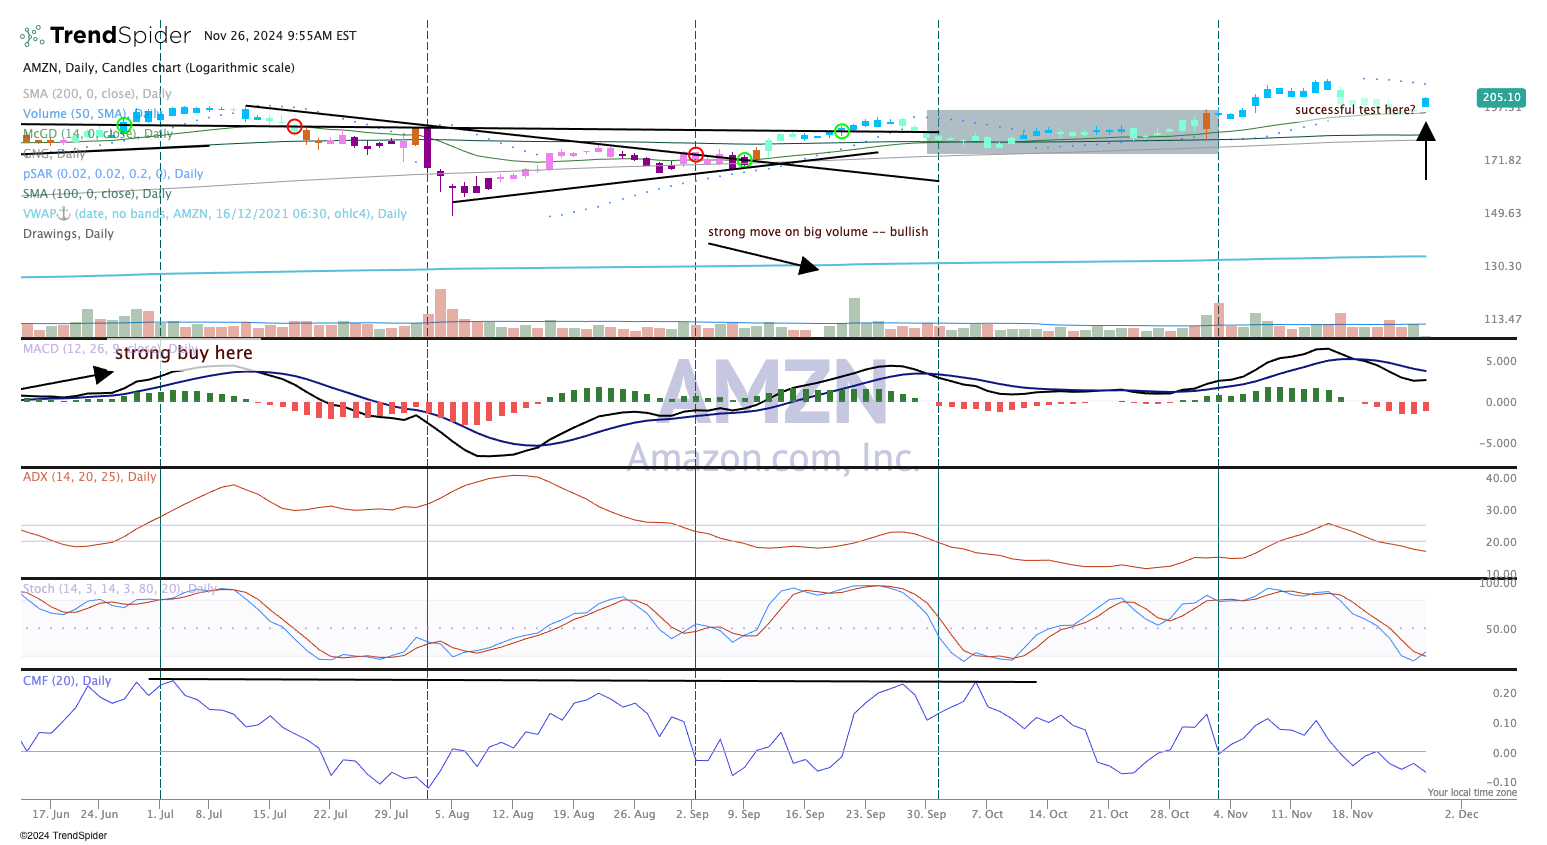
As for the chart, a recent pullback provides an excellent buying opportunity. The stock has come down to test the 14 period McGinley Dynamic (top pane), the stochastics (momentum) has just turned and is moving up (pane 4), while money flow is negative as is MACD (moving average convergece/divergence), which could be problematic. The sideways move (box) in October was constructive and now the stock is making new highs in November.
We'll give Amazon's chart the benefit of the doubt. The candles are blue or teal, which reflects bullishness on the GoNoGo composite of indicators.
We rate Amazon a One in TheStreet Pro Portfolio.
At the time of publication, TheStreet pro Portfolio was long AMZN.
