Charting the S&P 500: Clock Is Ticking on Indecisive Market
Sideways movement is neither bullish or bearish, but the new month may offer more clues to where we may be going.
You've reached your free article limit
You've read 0 of 1 free Pro articles.
Stocks have stayed elevated here for weeks and one can take a bullish or bearish view of the situation. The problem for the bulls lies in refusal to make a higher high. Yes, as we said last week, a long base means higher prices in the next move, but the bulls are running out of energy and could be subject to more violent swings like we had this past week.
Why is that? Well, money flows freely in markets from asset to asset and if one is not moving the capital will be emptied out in a hurry. You all saw that happen with gold and silver on Friday — stunning drops on very heavy volume hurt many late comers to the party.
Could this happen to the S&P 500? Very easily, but likely not to the same degree (I could be wrong). Remember, if stocks are not going up, they are probably going down.
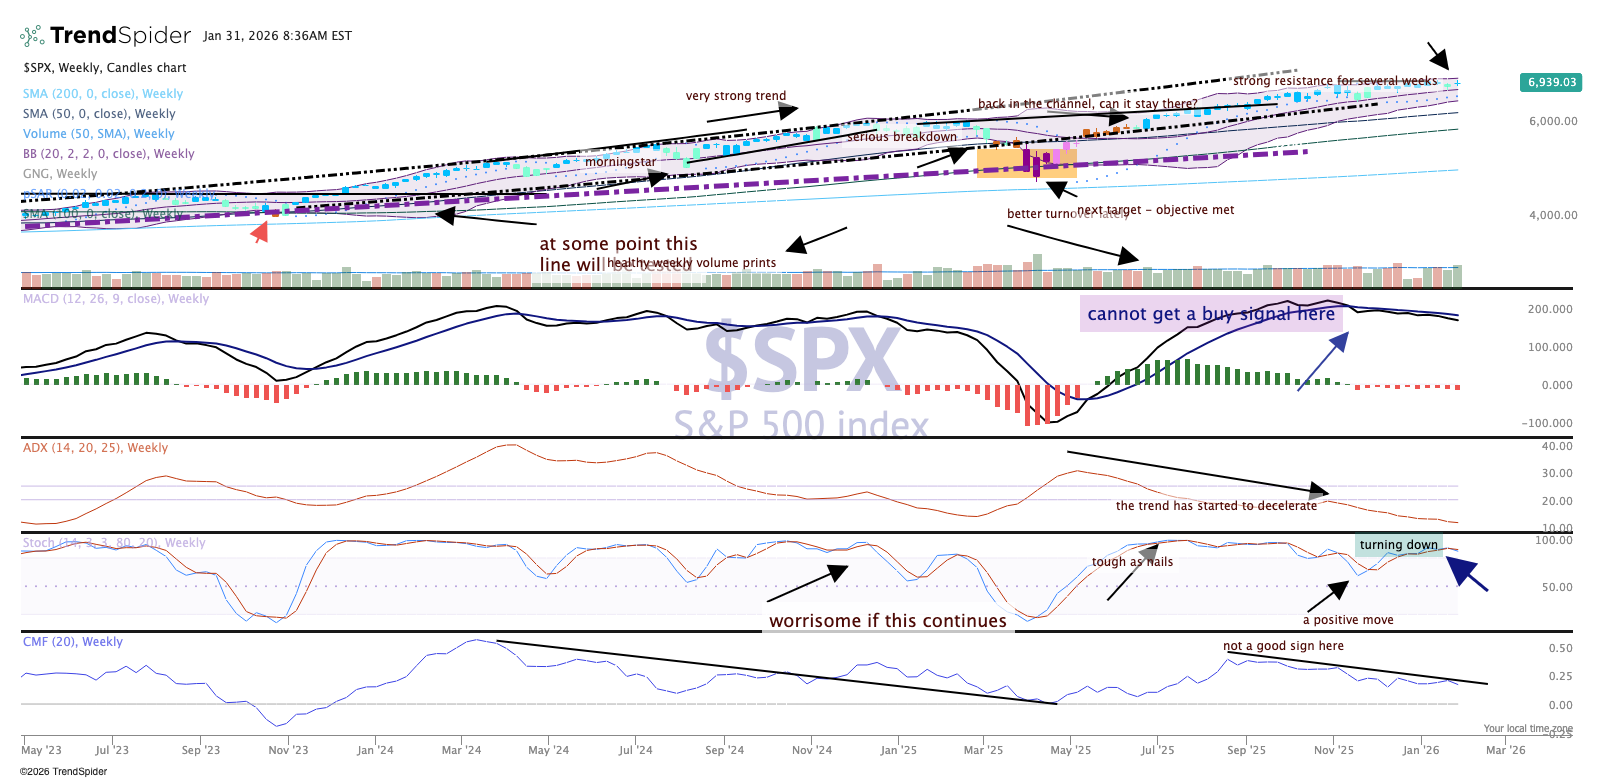
The doji printed last week is not inspiring confidence. This candle represents indecision by the bulls and bears.
The indicators are weakening, stochastics (momentum) are turning lower (pane 4) while money flow is making lower highs and lower lows. MACD (moving average convergence divergence) has been on a sell signal since mid-November.
Seasonal trends are still a bit bullish but the news and reaction to earnings has not; the new month may offer more clues as to where we may be going. January was a positive month, and that often means a positive year is coming.
