Charting the Markets: The Russell Is on a Run
Market breadth has improved as the Russell 2000 also moves higher; let's chart how this is playing out.
You've reached your free article limit
You've read 0 of 1 free Pro articles.
There is no question where strong breadth and internals originate from: The small cap stocks. We look at the Russell 2000 fund IWM and the index on which it's based as the proxy and the ETF we like to follow. The Russell 2000 index is often overlooked, as it does not have the sexy names like Nvidia NVDA, Apple AAPL or Microsoft MSFT.
Now, the Russell index is the smallest of the small, but on an equal-weighted basis it is the most important of them all.
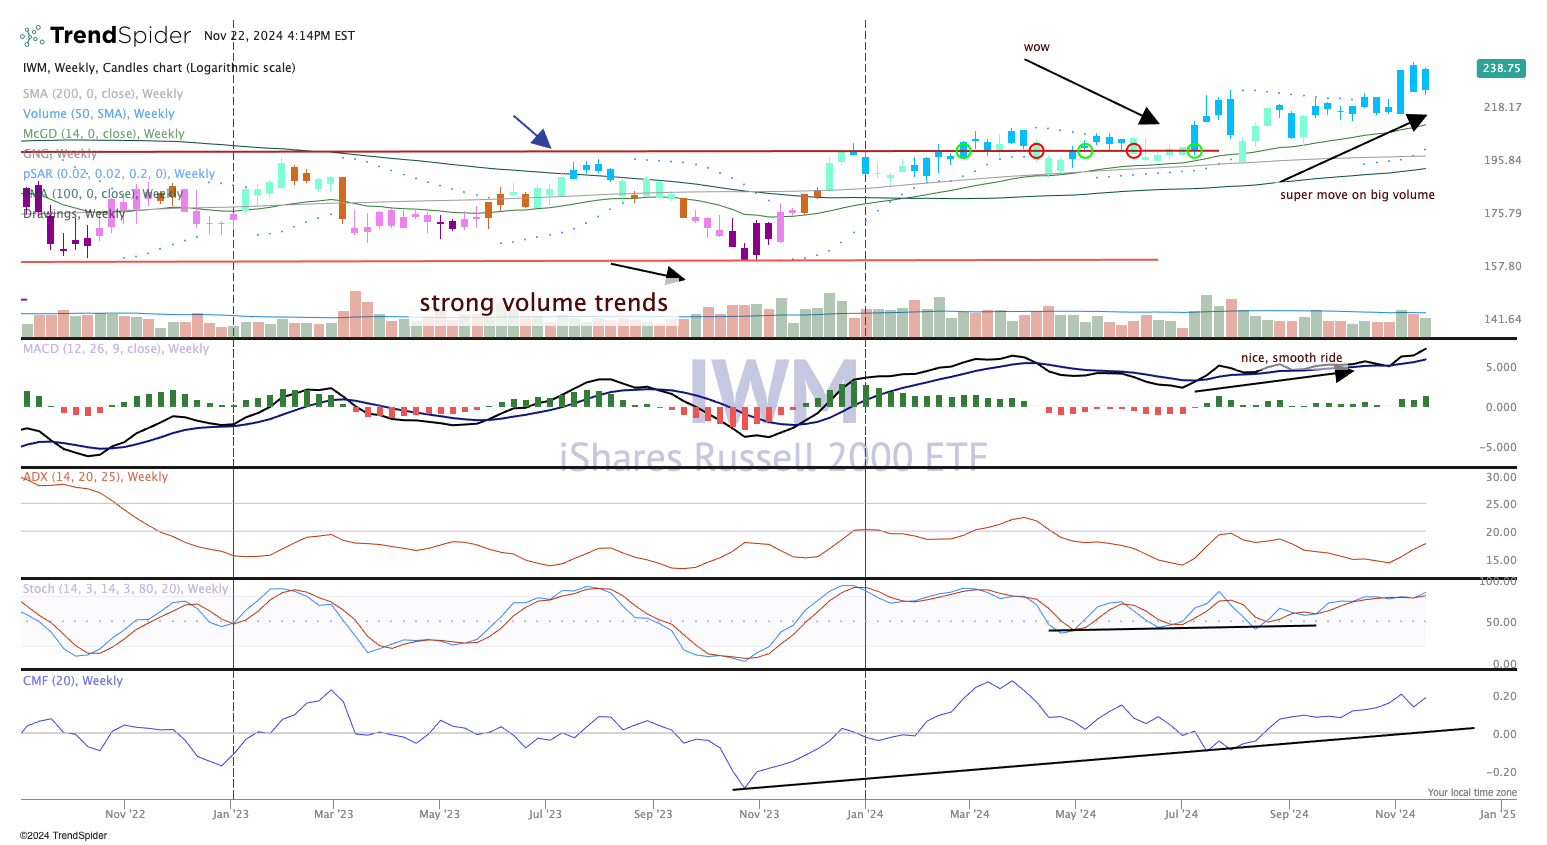
The strong performance of the IWM since July has been stellar, even though the index did not achieve a new all-time high with the S&P 500, Nasdaq or the Dow Industrials. That came later, of course, but the IWM has been bullish for a long stretch, nearly the entire year. Look at the candles in the top pane, and all you will see are blue and teal (bullish on the GoNoGo composite of indicators).
As for the secondary indicators, look at the second pane. There, we see it's strong and smooth on the Moving Average Convergence Divergence. In the third pane, the average directional index, or ADX, is making a move up, while the stochastics are embedded, which means dip buyers are active again. There is some serious upside to by the small caps as we move to the end of the year.
The Pro Portfolio is long AAPL, NVDA and MSFT.
