Charting the Markets: S&P 500 Embarks on New Ground
We mentioned last week our belief that a new marker was nigh. Here's what could be next for the index.
You've reached your free article limit
You've read 0 of 1 free Pro articles.
That was some week for the S&P 500 and other indexes. We had a wild Wednesday following the mildly surprising Fed decision to cut 50 basis points off the Federal Funds rate. That drove buyers to add stocks immediately but then sellers came in to bring the index down in what would play out as a "fake" move. The following day saw huge price movement, volume and a renewed buy signal on the weekly chart.
As many were expecting a poor month of September activity, it is turning out to be pretty good so far with just over a week left in the month. We made a slight adjustment to our channel in the top pane to include the lows from the prior two weeks. That adjustment widens the channel a bit and gives the price of the S&P index some room to maneuver up and down without breaking trend. But remember, the wider the band the more volatility, so that may swing the markets a bit more than usual.
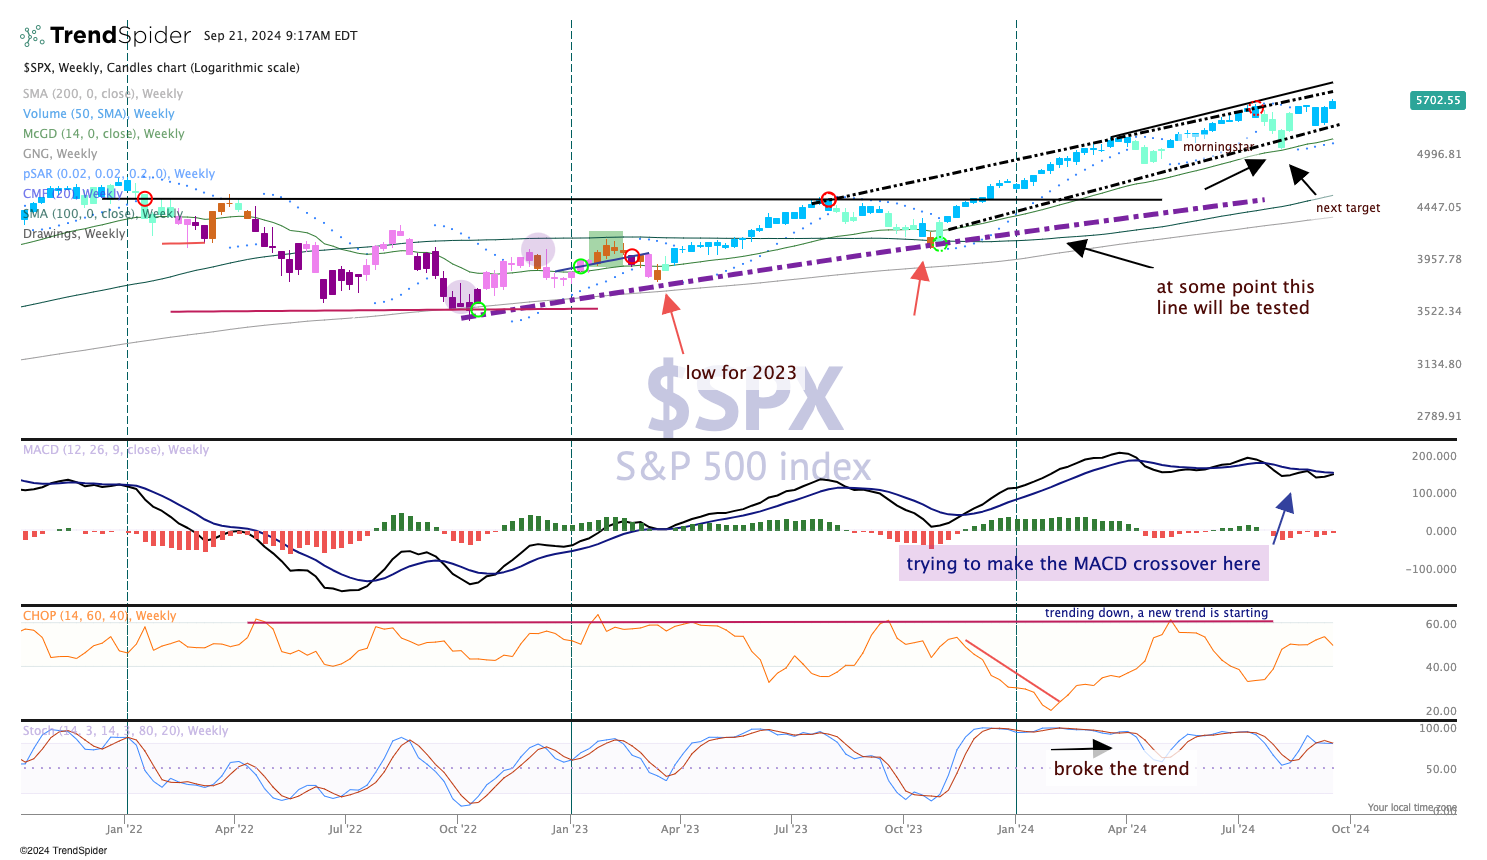
As we mentioned last week, Moving Average Convergence Divergence (MACD) is moving towards a buy signal. It crossed over this week (barely) and is looking to confirm the move (with another strong week as the black line crosses the red line).
Stochastics remain strong as the bulls are in control of the momentum. Candles in the top pane remain blue, which is a strong bullish condition according to the GoNoGo composite of indicators.
What's next? We see a bit of consolidation here for the next couple of weeks into earnings season and then perhaps a run to 5850 by the end of the year.
