Chart of the Day: This Tech Position Is in the Basing Process
After a dramatic fall with a little help from its 'friends', it is time to rebuild the chart.
You've reached your free article limit
You've read 0 of 1 free Pro articles.
As we have spoken about previously and can see clearly on the chart, Applied Materials AMAT has been under attack by the sellers with a passion.
The heavy selling started back in July when the stock peaked. The bears have been relentless here, selling with aggression and force. Applied has fallen sharply and on heavy volume, with a little help from its "friends."
Recall some of its competitors like ASML ASML and Lam Research LRCX came in October with poor guidance on earnings. That was enough to rip a hole in the chart of Applied Materials, but it seems to have found some solid footing.
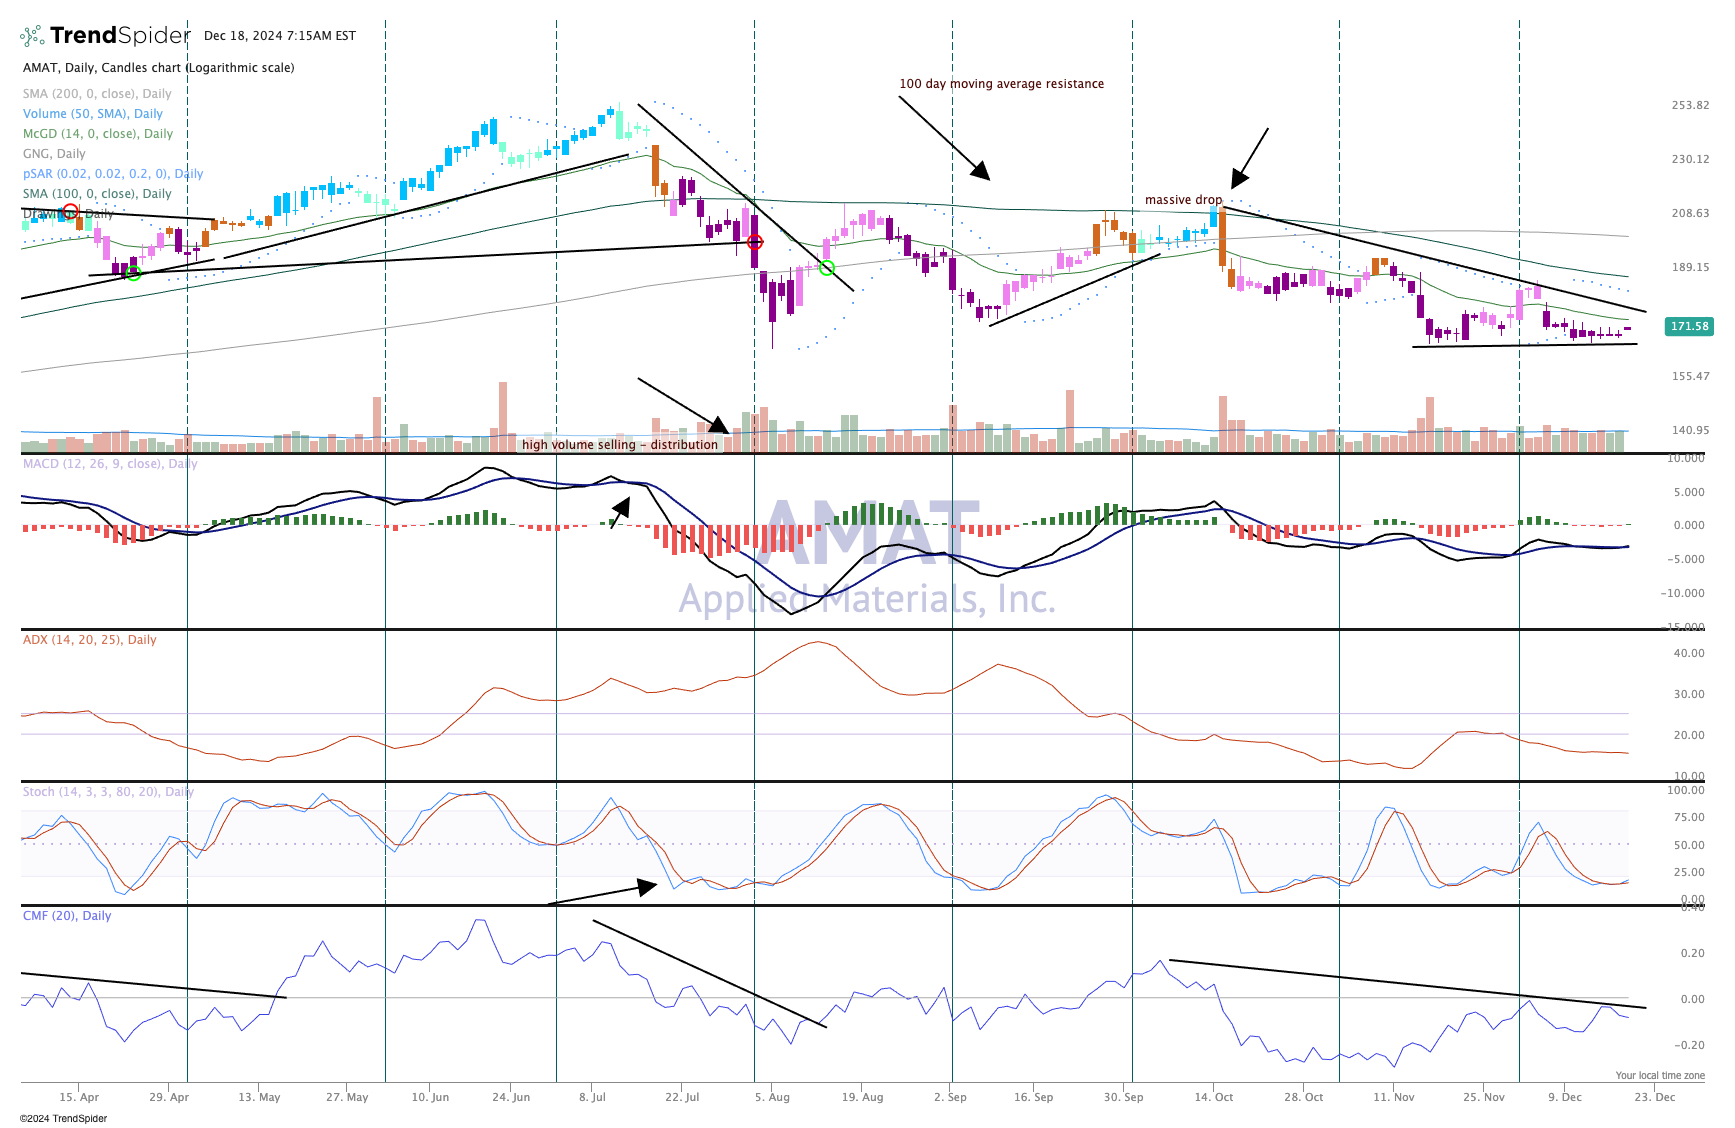
What is interesting here is the action in the stock over the past month. AMAT is clearly basing, and has found some support at the $170 level. On several occasions the price zone of $170-172 has been tested and held. Notice other times since July the basing process was just too difficult at certain levels, but this one looks quite firm.
What next?
We like a long base after a wild and volatile period such as we experienced. The indicators are not bullish yet but they seemed to have bottomed out, and there is nowhere to go but up for the MACD (moving average convergence/divergence), stochastics and money flow.
It is correct to note the candles in the top pane are bearish and have been for many weeks. This will take some time but when they turn at least neutral (amber) then we should see improvement in the indicators. This may be a good spot to add, a safe place where buyers have consistently been there to buy the stock.
We like Applied Materials in TheStreet Pro Portfolio and rate it a Two, or stockpile on pullbacks.
At the time of publication, TheStreet Pro Portfolio was long AMAT.
