Chart of the Day: Qualcomm Continues Its Winning Ways
Heavy volume and strong price action dictate the move for this big semiconductor company.
You've reached your free article limit
You've read 0 of 1 free Pro articles.
When a stock such as Qualcomm QCOM moves up and out making higher highs, higher lows it is a dominant bullish trend. If you want to fight that trend, be our guest but the momentum is so strong it will simply bowl you over.
We look at a chart like this and marvel at it but also are aware that sellers will come out unannounced. Strong trends can stay that way for quite some time, and with QCOM at all-time highs and overbought the buyers just can't seem to get enough.
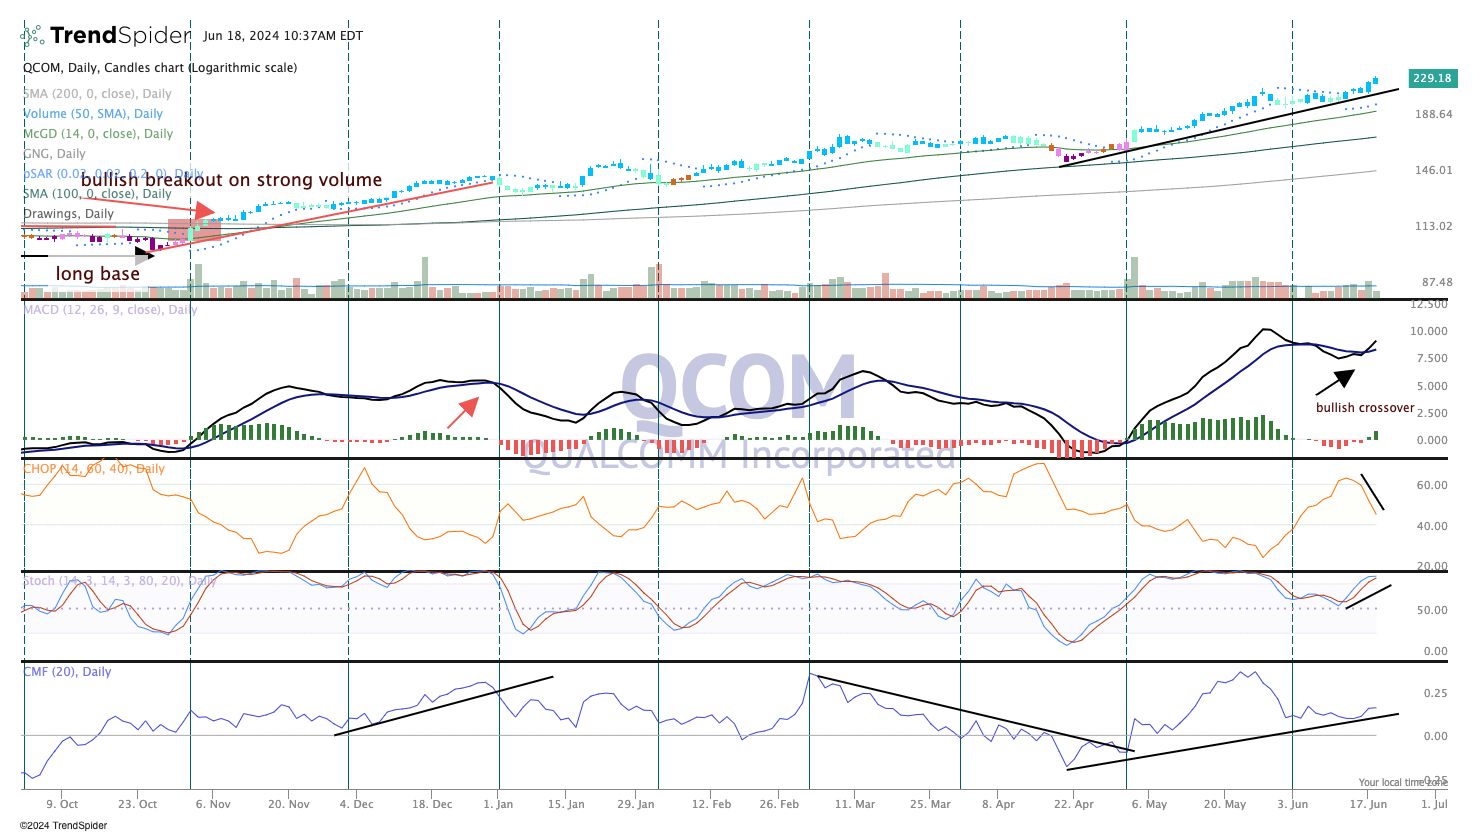
The technicals are strong, price action and volume soaring, but what's very impressive are the secondary indicators. Money flow (bottom pane) is back on its horse while we see a nice positive divergence between the choppiness index (pane 3) and stochastic (pane 4). This combination of down choppiness, up stochastics tells us the stock is trending and momentum is heating up. That is the fuel behind the strong move here and why we believe there is more to go.
Moving Average Convergence Divergence (MACD) is also on a renewed buy signal.
All systems are go for Qualcomm. We rate the "Big Q" a Two in TheStreet Pro portfolio.
More Pro Portfolio:
- We Are Calling Up a New Portfolio Position From the Bullpen
- Weekly Roundup: A New Name Joins the Portfolio
- Signals From Our Investing Notebook
At the time of publictaion, TheStreet Pro Portfolio was long QCOM.
