Chart of the Day: Our Newest Name Shows an Opportunity Down the Road
If the stock can continue this recent run to resistance, we might see a breakout moment.
You've reached your free article limit
You've read 0 of 1 free Pro articles.
Last week we initiated a new name to the TheStreet Pro Portfolio. We explained why we added of Elastic N.V. ESTC at the time, but the chart may have a different explanation that is looking to play out over the intermediate term (2-6 months).
Notice in the second pane of the chart below the buy on the Moving Average Convergence Divergence (MACD), which got under way a couple weeks after the devastating move down in late August. In fact, all of the indicators fell on that day, but we also see how a bottom was formed a bit lower just days following. That is important to see, and since then a series of higher lows is in place.
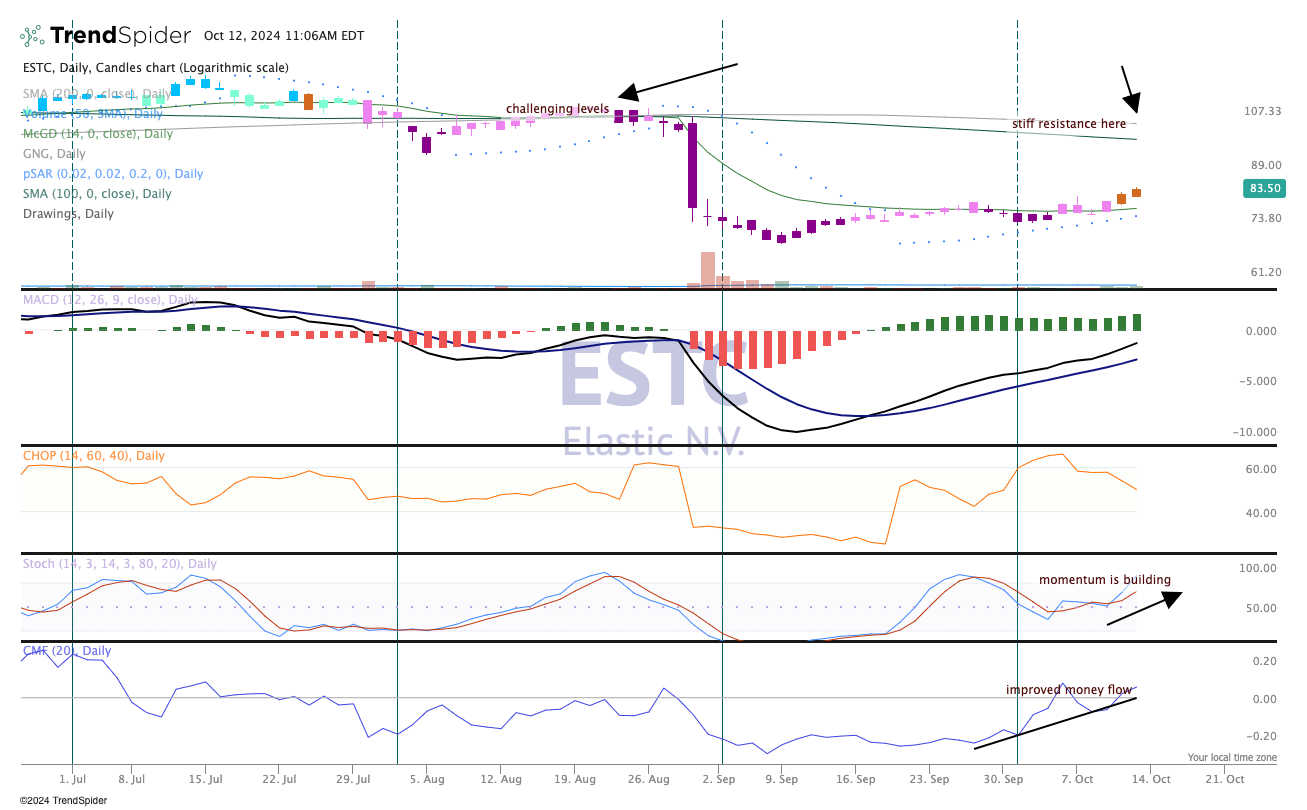
Money flow is improved — it is now bullish (bottom pane). Momentum is starting to build as we see in stochastics, but heavy resistance is ahead with the interim top in August, the gap down point and the long-term moving averages. But that spot is in the area of $102-$106, which means a potential 20% gain to resistance zone from current prices. Not too shabby if the stock continues to run.
We rate Elastic a One in TheStreet Pro Portfolio.
More Pro Portfolio:
- Why We Opened a Position in a $8.4 Billion AI Name
- Weekly Roundup: Portfolio Begins October With Big Gains and Big Moves
- We Did the Homework for You: Here're the Top Stories on Our Investing Themes
At the time of publication, TheStreet Pro Portfolio was long ESTC.
