Chart of the Day: Lockheed Martin Is Set for Takeoff
Technicals have improved in the stock since the last earnings report.
You've reached your free article limit
You've read 0 of 1 free Pro articles.
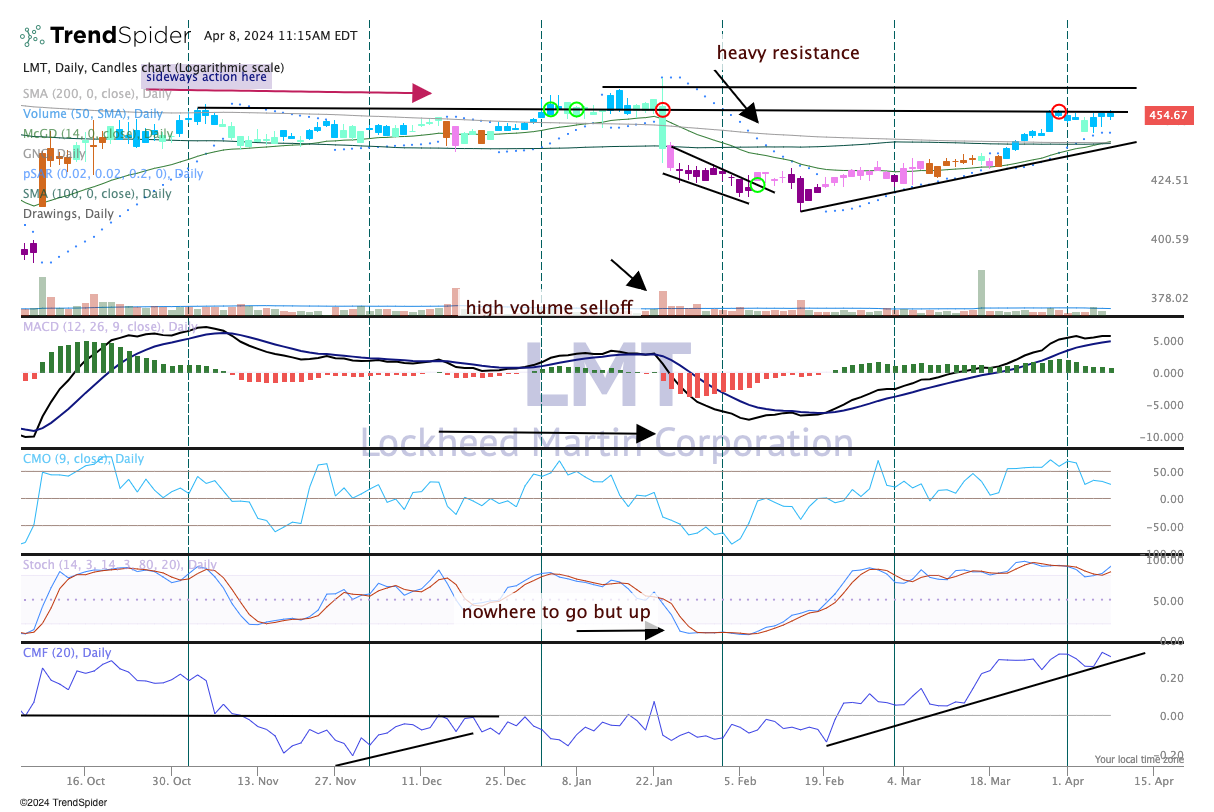
With a series of higher highs and higher lows in the chart, Lockheed Martin LMT is on the move and ready for a substantially higher level.
We can see in the indicators, below, the very bullish condition. Note the money flow at the bottom which is peaking and holding at a high level.
Also, stochastics (momentum indicator) in the fourth pane is bullish and now embedded. This means that buyers will likely step in to buy the 'breaks', or when the stock pulls back. This is considered a low-risk entry approach as supply (stock) is thin while the demand for shares is robust.
To view this chart in a new window click here.
The only issue we may have here is a stock that is modestly overbought and now at resistance. For a continuation move the stock would need to be above $465, and then we could see Lockheed Martin attack the $500 level again.
This current spot might be a good area to grab some shares. We rate LMT a two in TheStreet Pro Portfolio, or 'stockpile on pullbacks'.
At the time of publication, TheStreet Pro Portfolio was long LMT.
