Chart of the Day: Costco's on Sale
Let's see why the recent pullback may represent yet another tremendous buying opportunity in this great retail chain.
You've reached your free article limit
You've read 0 of 1 free Pro articles.
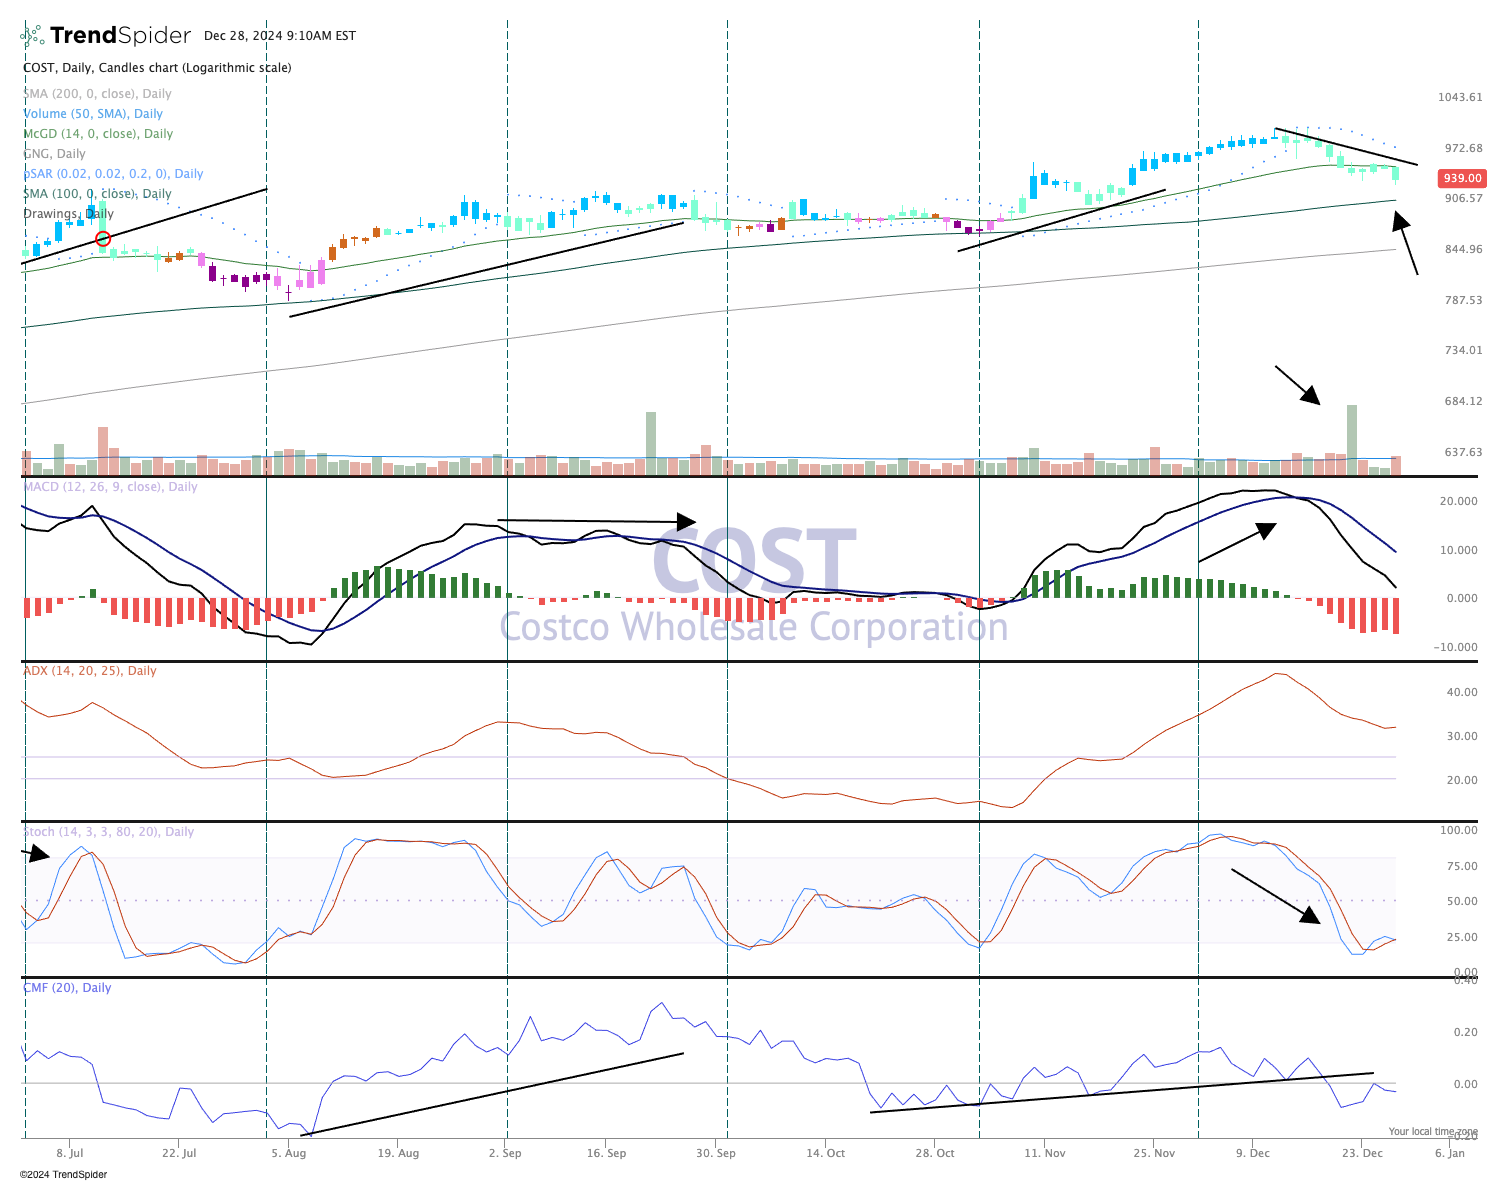
We have not looked at Costco COST in a while, but it has certainly been volatile since. The stock has pulled back sharply over the last few weeks, with a series of lower-highs and lower-lows. That is our textbook definition of a downtrend, but within a longer- term uptrend, that is acceptable.
The recent selling, however, has been on pretty strong volume. And, let's be clear: Some of those big bars on the selling days were large institutions exiting Costco.
But we have been here before, when the stock pulls back and seems to show more downside to come, but snaps right back up.
This could be another one of those moments. Money flow, as seen in the bottom pane, has receded mildly. Also, the Moving Average Convergence Divergence in the second pane, is on a sell-signal now (since mid December), while momentum is deflated.
The 100-day moving average (arrow, top pane) is where we think Costco will find support, call it $907. Even adding at current prices after a. 4% pullback would not be bad, either.
We like Costco and rate it "Two" in TheStreet Pro Portfolio.
The Pro Portfolio is long COST.
