Chart of the Day: Bullish Microsoft Could Power Up Soon
After moving sideways across the screen for months, MSFT appears setting up for a move higher.
You've reached your free article limit
You've read 0 of 1 free Pro articles.
A sideways move by Microsoft MSFT over the past six months looks to be setting up for a substantial move higher, if the stock can get a push over some resistance, which we show as the September high. We like the chart here; it is constructive as Microsoft works to burn off some of the froth from an earlier run.
A recent series of higher-highs, higher-lows in the daily chart may be just what is needed for that push higher. The parabolic SAR (stop and reverse) in the first pane is now bullish, and the Moving Average Convergence Divergence indicator in the second pane has crossed over for a bullish signal.
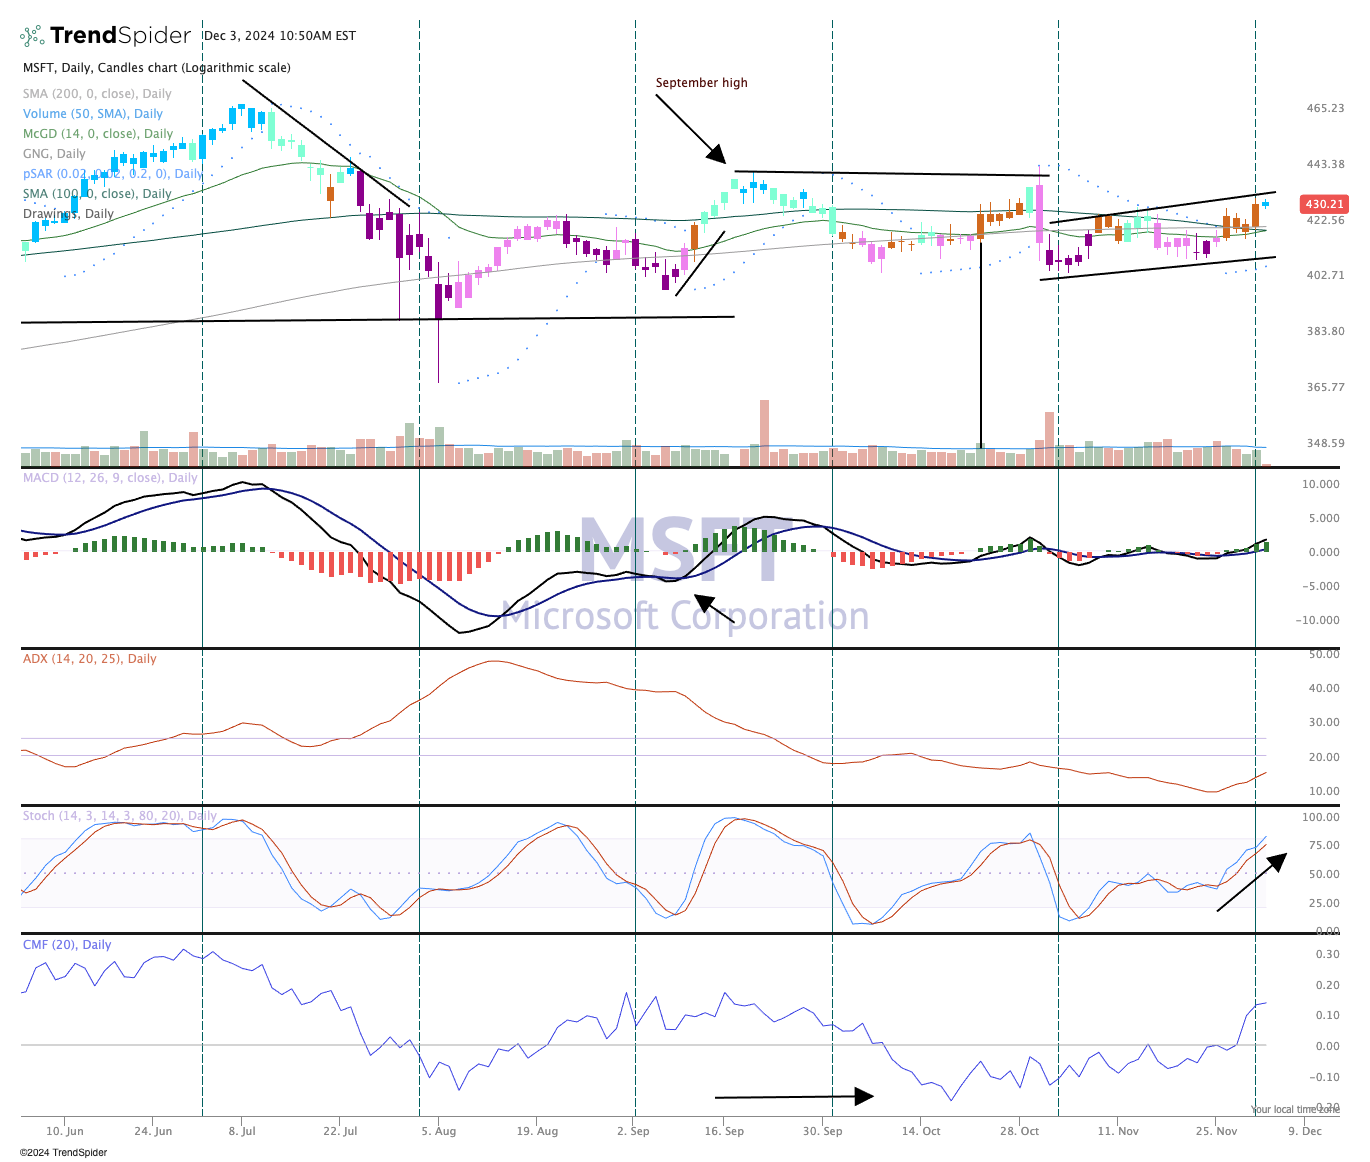
Momentum is finally catching on, though, with good money flows (see the Chaikin Money Flow at the bottom) and stochastics are racing higher.
Certainly better price action is going to be needed for that big push above the September highs. That we are in a seasonally strong period for stocks, however, with Microsoft less than 10% away from all-time highs printed in July, this certainly seems like the time.
We like Microsoft and rate it a "Two" in TheStreet Pro portfolio, stockpile on pullbacks.
The Pro Portfolio is long MSFT.
