Chart of the Day: Bank of America's Strong Uptrend Continues
The indicators are pretty bullish here.
You've reached your free article limit
You've read 0 of 1 free Pro articles.
Bank of America BAC has been steadily rising since a breakout move in December, 2023. With a stair step pattern of higher highs and higher lows this is textbook definition of an uptrend.
That means pullbacks are bought, which we have seen happen since then. The "scary" pullback in mid-April was meant to shake the trees a bit, and move shares from weak hands to the strong. Since that shakeout, Bank of America is higher by about 12%.
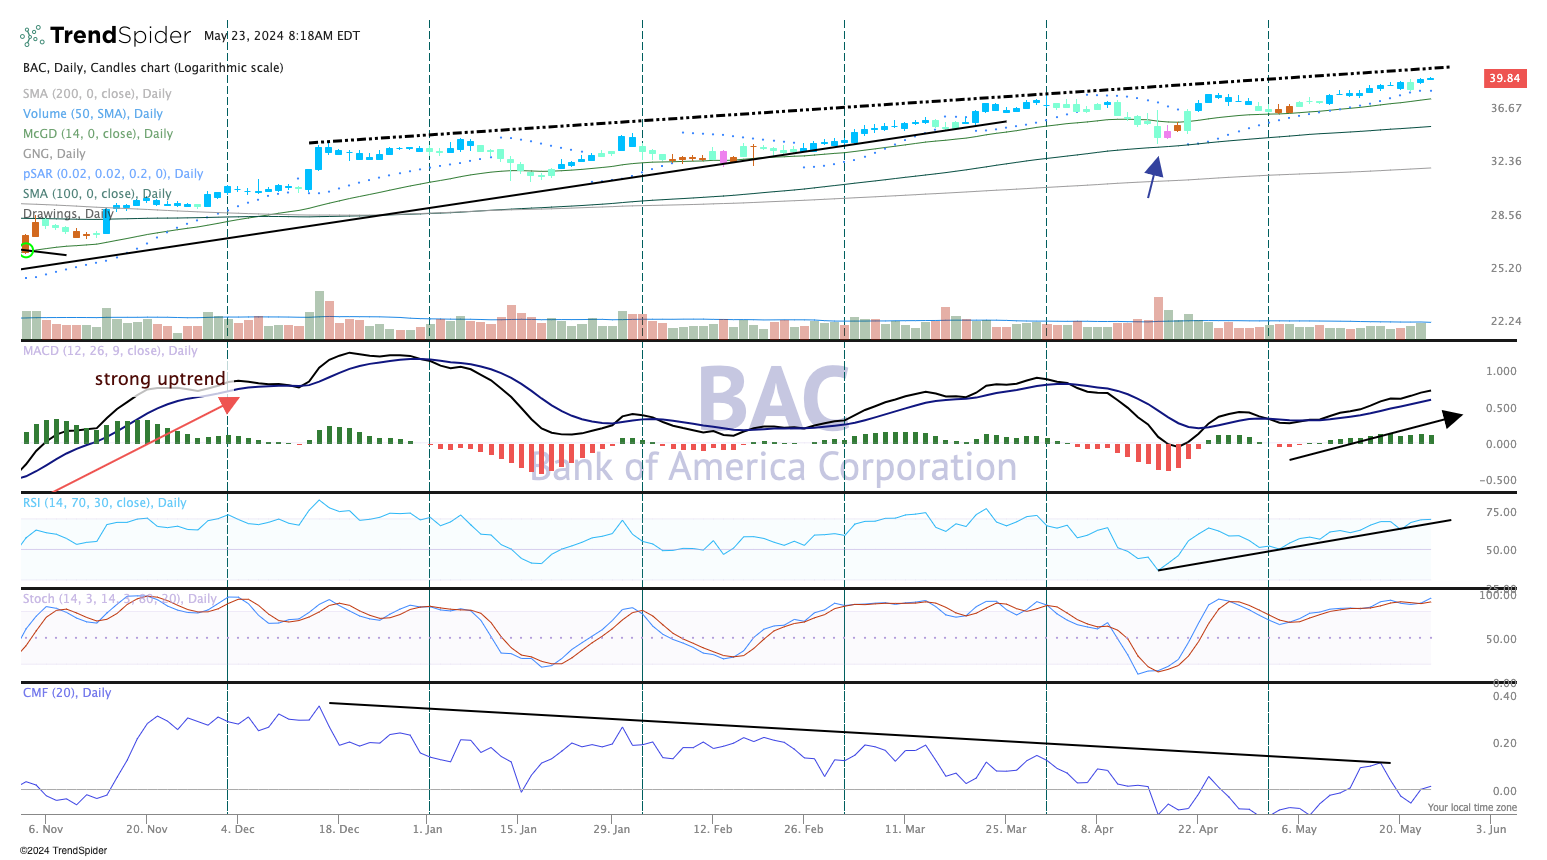
The indicators are pretty bullish here. The parabolic SAR (stop and reverse) in the top pane has been bullish since mid-April. Candles have been blue in the GoNoGo composite of indicators which means strongly bullish.
Notice the strength in the momentum indicators RSI and stochastics (pane 3 and 4). MACD (moving average convergence divergence) is also on a strong buy signal.
We see clear sailing here at least until $43. If the stock dips it would be a buying opportunity.
We rate BAC a Two in TheStreet Pro portfolio, which is stockpile on pullbacks.
More Pro Portfolio:
- Locking in Some Big Gains, and Buying More of Another Position
- Weekly Roundup: Fed Hits the Brakes on Rate-Cut Hopes
- Signals From Our Investing Notebook
At the time of publication, TheStreet Pro Portfolio was long BAC.
