Chart of the Day: Axon Is Showing Some Bullish Flare
The stock is improving but remains in a range.
You've reached your free article limit
You've read 0 of 1 free Pro articles.
There is nothing better than a nice, long tight base in the price action to help us predict the next move. That's the case with Axon Enterprise AXON currently, with a rather tight base since breaking out of another uptrend back in February.
As legendary technician Louise Yamada puts it: "The bigger the base, the higher in space." Essentially, a stock like AXON is likely to move up eventually, but we won't know when until it actually occurs.
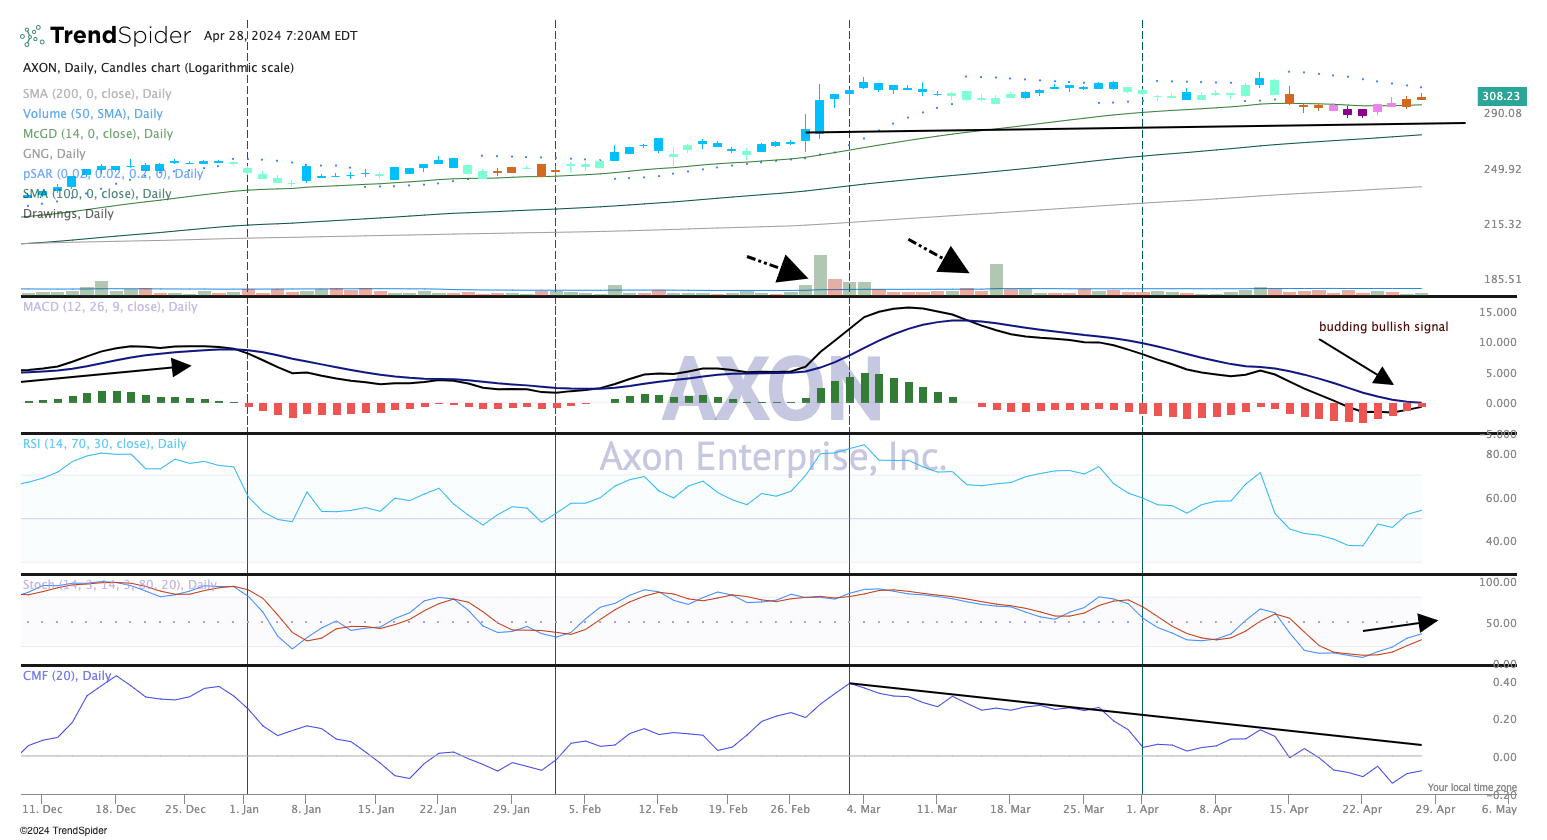
The candles in the top chart showed a progression from blue (bullish) to teal, to amber all the way to purple (bearish). But notice the stock never broke the breakout level in February. Translation: Hot money left, the big money players stepped in.
To view this chart in a separate window, click here.
The indicators are starting to open up and show some bullish qualities. Stochastics (momentum) is looking much better while the moving average convergence divergence (MACD) is about to confirm a bullish crossover.
The last one that moved from bearish to bullish was in early February, in front a of a nearly 30% move higher. This is one we want to pay close attention to. RSI (pane 3) is improving as well.
As for the stock price, we are looking for more upside if AXON closes above $324.
We rate AXON a two in TheStreet Pro portfolio, which is stockpile on pullbacks.
At the time of publication, TheStreet Pro Portfolio was long AXON.
