Chart of the Day: Applied Materials Is Right Where It Should Be
That it's carving out a base in a higher range is very bullish.
You've reached your free article limit
You've read 0 of 1 free Pro articles.
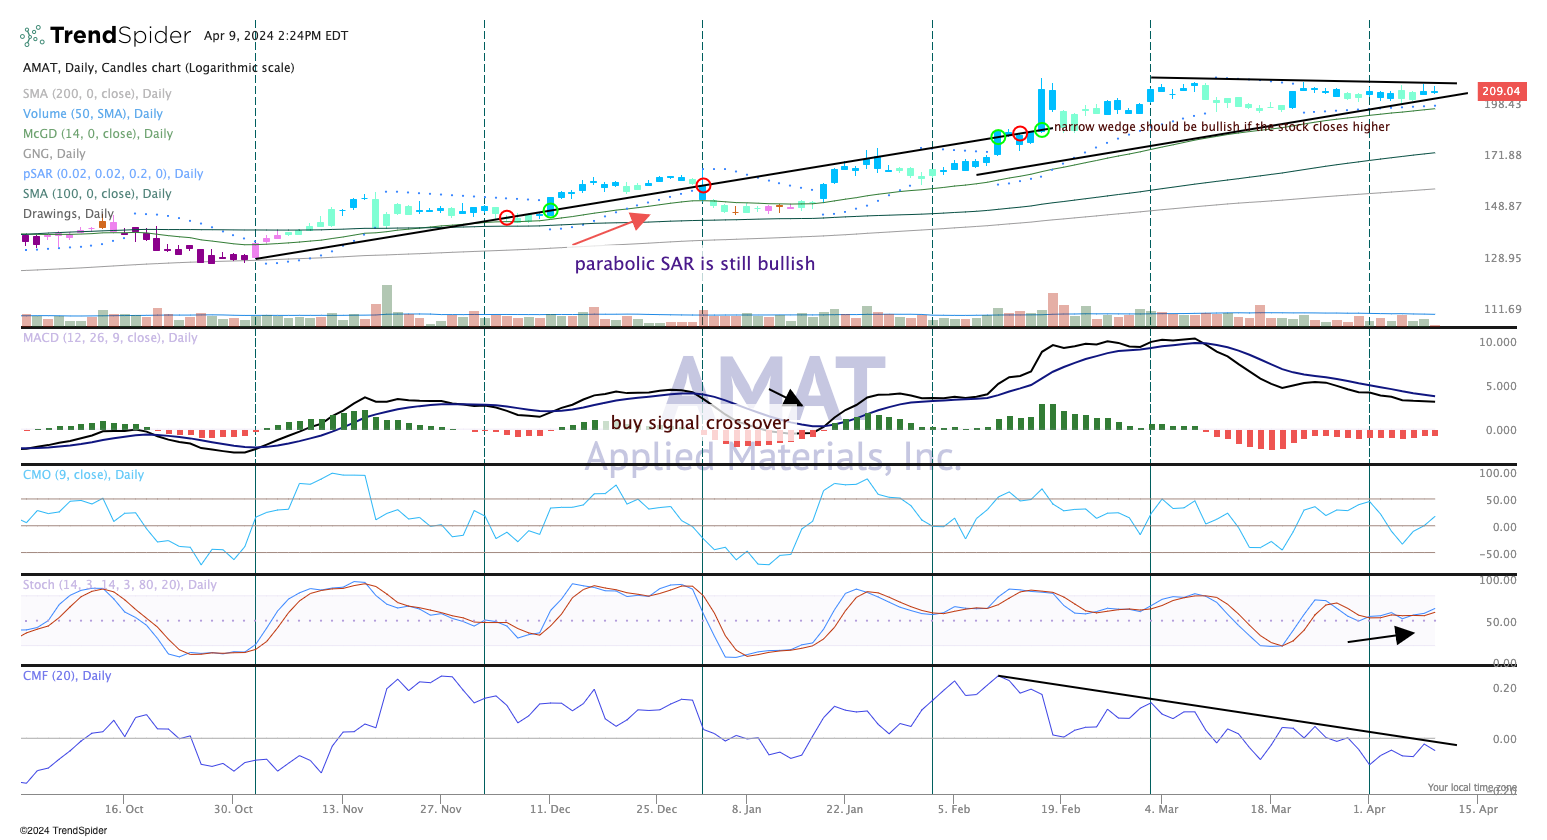
There is little doubt that the chart of Applied Materials AMAT is quite bullish, but the momentum has worn off since a powerful rally in February.
That's okay though, as we often see a 'resting' period following a big move up, then a stair step pattern higher, retaining the textbook uptrend of higher highs and higher lows.
At this point the chart remains bullish, but on the other hand the supporting indicators are not as bullish. But before we get too concerned, those indicators are simply burning off a very overbought condition from a month ago, and frankly are ready to ride higher with the price of AMAT.
To view this chart in a new window, click here.
The stochastics, a momentum indicator based on oversold and overbought conditions is curling upward, probably the first one to show signs the stock is actually bottoming.
Volume trend (top pane) has cooled off as well, again another signal the stock is resting and ready for the next move - we believe is higher. Parabolic SAR (stop and reverse) in the top pane is bullish, which will provide good support.
We like AMAT here and believe when earnings come around in May this stock will be much higher than it is currently. We rate Applied a two in TheStreet Pro portfolio, or 'buy on pullbacks'.
At the time of publication, TheStreet Pro Portfolio was long AMAT.
