Chart of the Day: Alphabet Punishes the Non-Believers
The stock is up a whopping 28% since bottoming a month ago.
You've reached your free article limit
You've read 0 of 1 free Pro articles.
It certainly helps your stock rise up if a slate of short-sellers piles on when it appears the shares are vulnerable to more downside. That is what happened to Alphabet (GOOGL) during a two-month stretch when sellers took down the mighty search/AI company about 20%. That move, down to about $275, set off some buy triggers that have continued to present day.
It's an astonishing move for this mega-cap to lose 20% in value only to recover all that was lost and then some. Currently, the stock is sitting near all-time highs.
Alphabet will report earnings on April 29 after the close. It will likely be a strong report but investors have to worry if the good news may already be baked in.
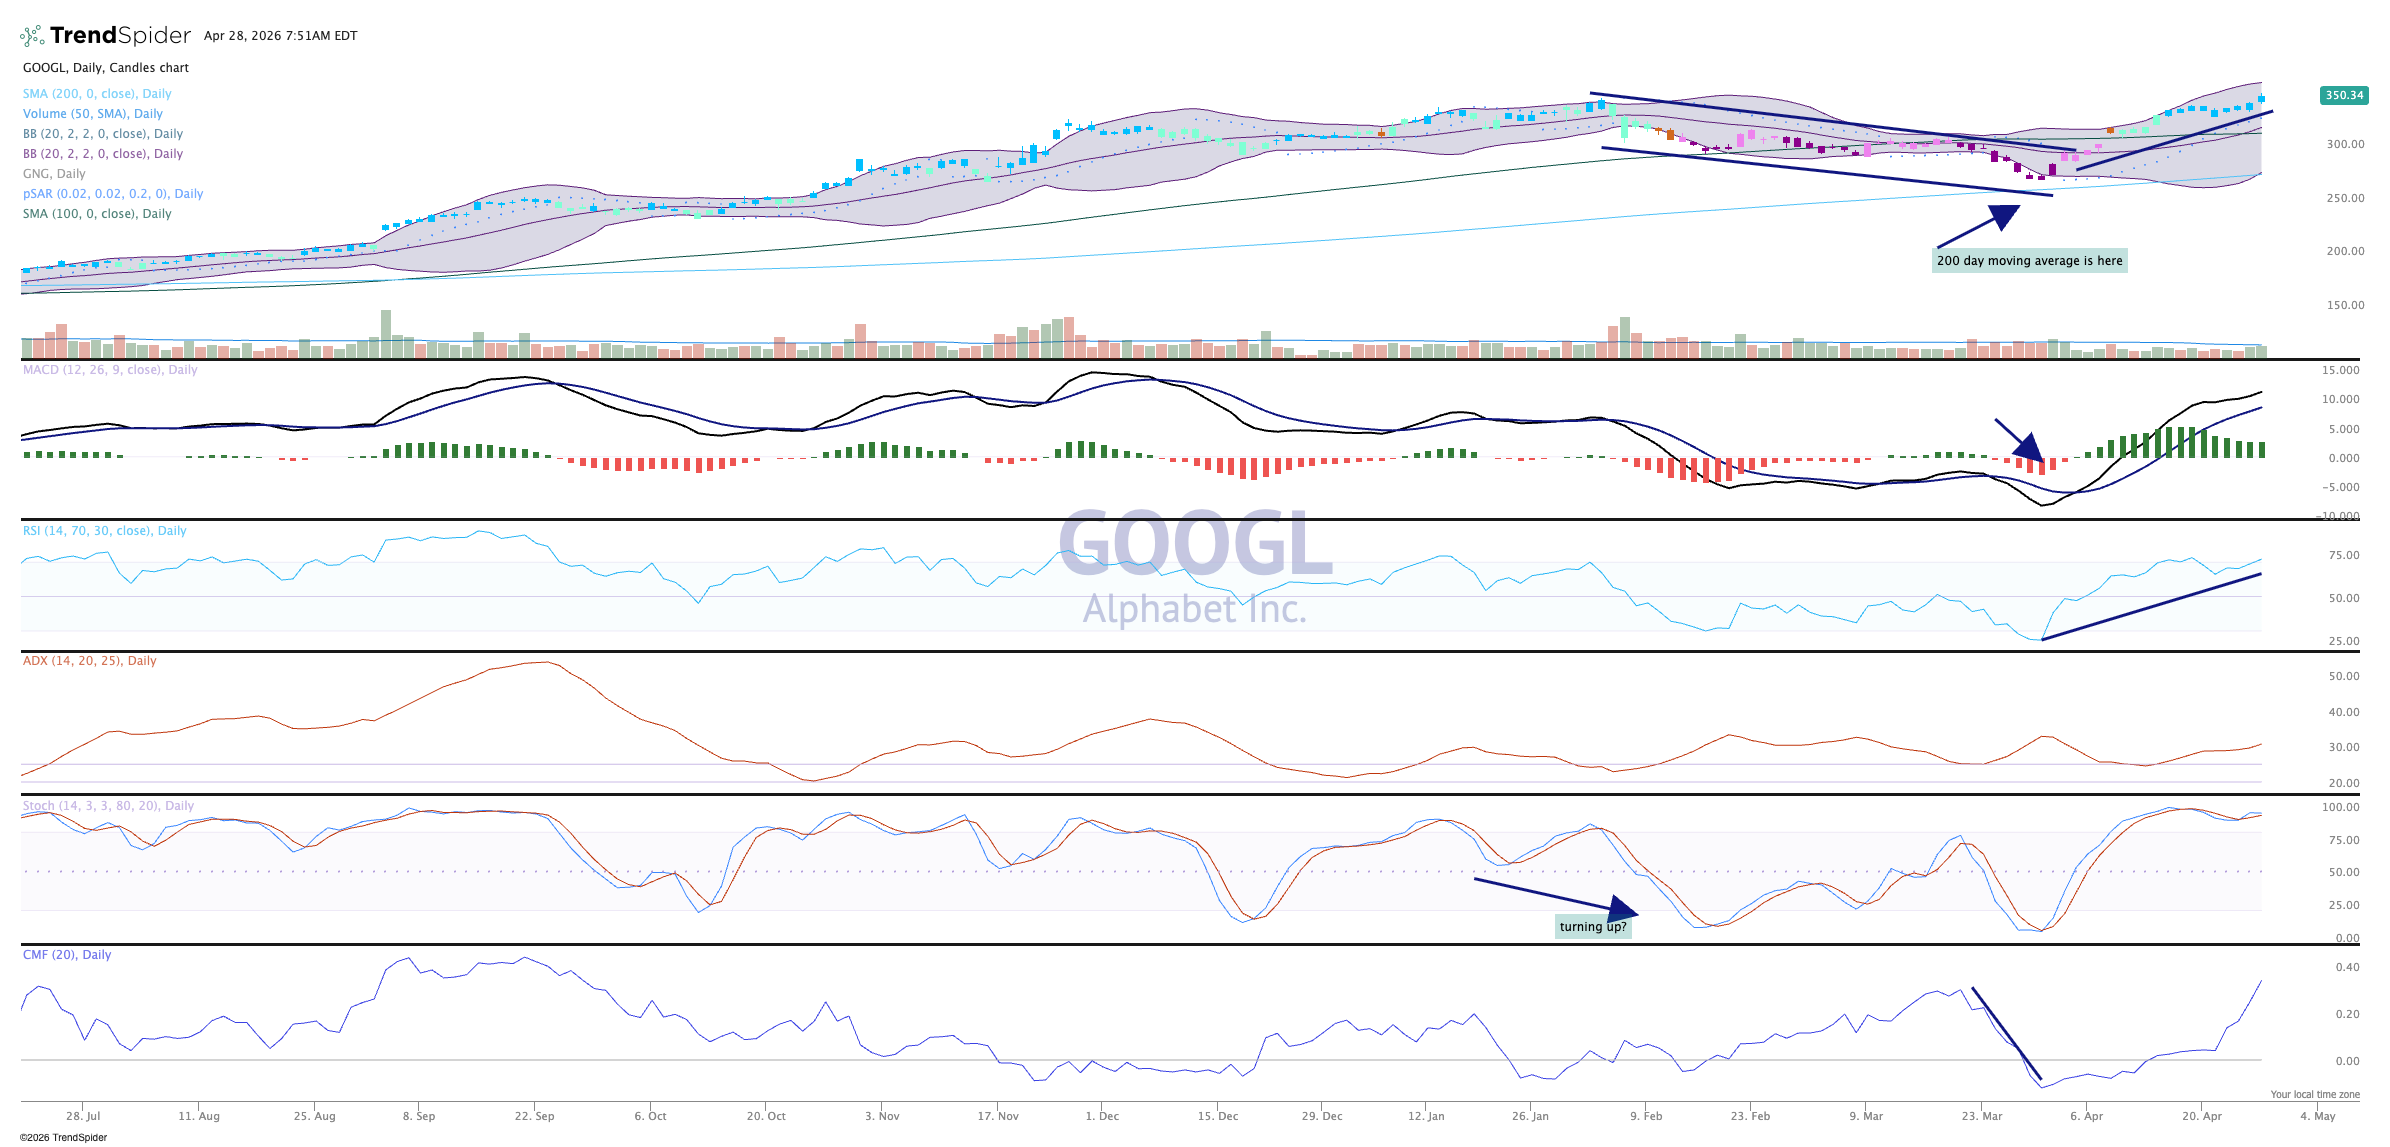
The chart is very strong with indicators supporting the recent move up. Candles are back to blue (strong bullish) after a brief sojourn into the purple (bearish). Money flow (bottom pane) has exploded higher, and stochastics are embedded overbought (means dip buyers are active and will buy those dips aggressively).
MACD is overbought but still on a buy signal, parabolic SAR (stop and reverse) remains on a buy signal, too. There's nothing wrong with the chart here, just a bit overbought.
We like Alphabet in TheStreet Pro Portfolio and rate it a Two, or "stockpile on pullbacks."
Related: Why Did the Meta Deal to Buy Manus Fall Apart?
At the time of publication, TheStreet Pro Portfolio was long GOOGL.
