With Complacency at an All-Time High, Dr. Copper Is Trying to Tell Us Something
Here's why we should all be on high alert going forward.
You've reached your free article limit
You've read 0 of 1 free Pro articles.
I’ve been a futures and options broker for over two decades; I’ve seen, experienced and felt a lot. And what I am seeing on my quote board, hearing from the talking heads and reading on social media and chat boards this week is concerning. Complacency is at an all-time high, while event risk is arguably similarly elevated. We should all be on high alert going forward.
There are severe disconnects in market narratives between asset classes. The most glaring thing is the treasury market swoon, which can be attributed to multiple factors, but the loudest people in the room are shouting about higher inflation expectations.
Yet, in most commodity markets, the theme is deflation rather than inflation. For instance, the grain markets are at multi-year lows. Natural gas has been flirting with a $2.00 handle all year, and crude oil can’t hold a rally longer than a few days. Even more telling could be the price action in copper. Copper futures experienced a temporary boost from Chinese stimulus but have since been swirling the toilet bowl. We suspect the selling will make its way under $4.20 support to a long-term trendline near $4.00. This is not inflationary.
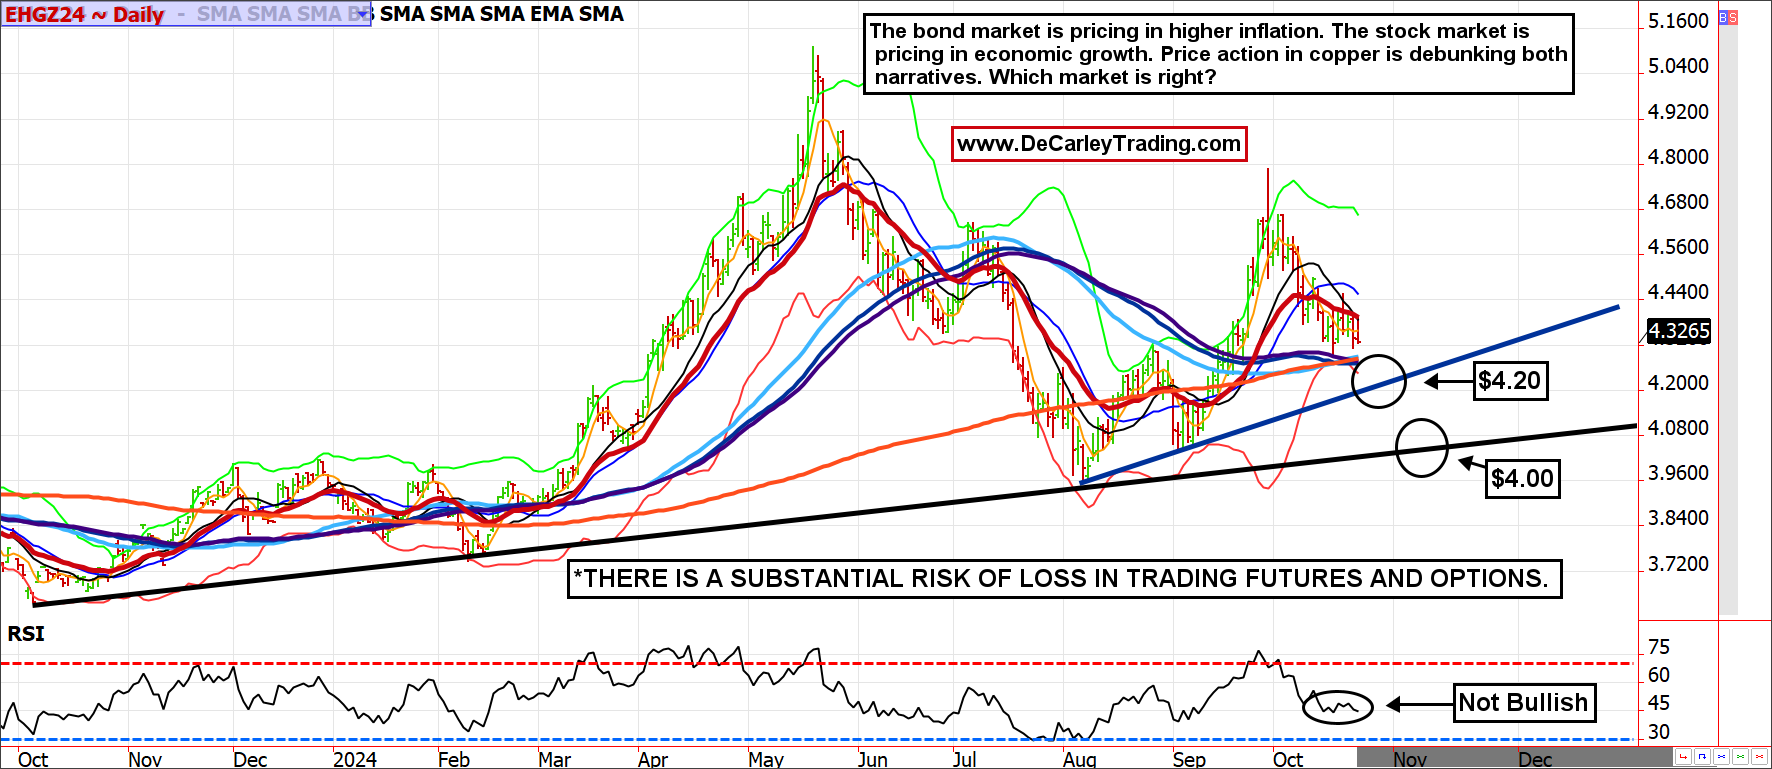
Further, the stock market has been pulling forward earnings and gains for two whole years now. I believe current valuations are overstretched and made possible by government and central bank stimulus, rather than booming economic growth. Yet, Dr. Copper, a commodity considered an economic bellwether, tells another story. Either copper traders or financial futures traders are wrong; they can’t all be right. We are in the camp that the copper market is trading true to its fundamentals. At the same time, stocks and bonds have veered off course through speculation or even aggressive hedging and price chasing as banks, funds and speculators have been caught wrong-footed in recent years due to Fed pivots in interest rates and jawboning.
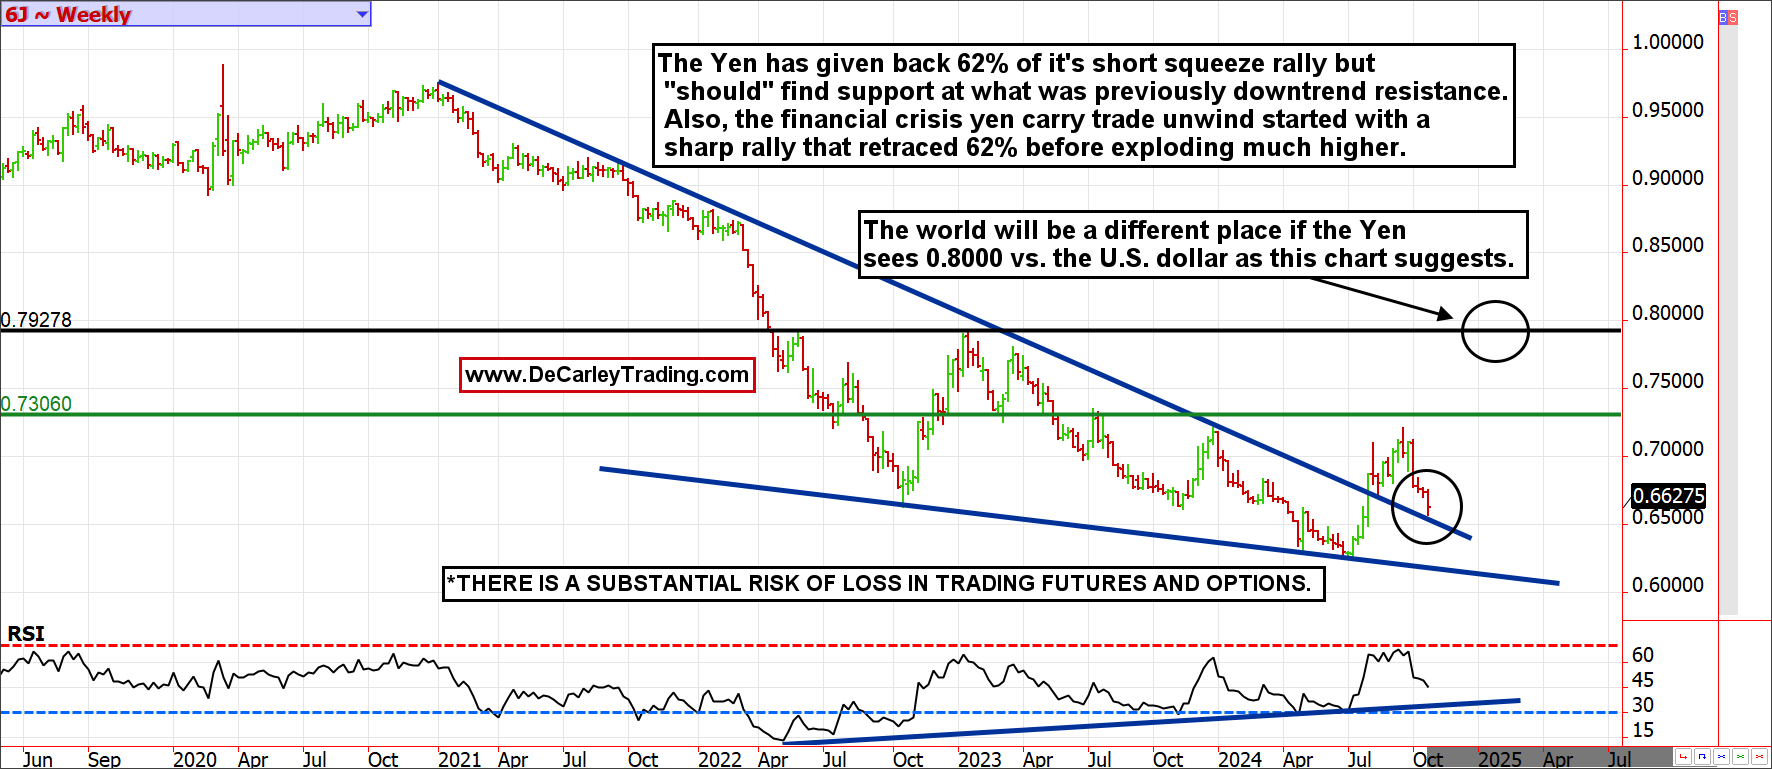
One more thing we would like to bring to the attention of our readers is the Japanese yen. The reverse-carry trade (the unwinding of positions where investors borrowed yen to purchase assets such as stocks and gold) has fallen to the wayside. This is precisely what occurred going into the financial crisis. The carry trade began to unwind in the summer of 2007, retracing 62% of the short squeeze rally before resuming the carry trade unwind and playing a pivotal role in a global economic blowup. For those unfamiliar, 62% is a Fibonacci ratio that technical analysts generally expect to act as a pivot price. Thursday's sell-off in the yen is, you guessed it, 62% off the recent high. Further, the daily low was on the downtrend line, which confirmed the breakout on the way up. More often than not, previous trendline resistance later becomes support after a breakout.
Maybe we are making too much of the similarities between today and 2007 and 2008, but humans drive markets, and we are all creatures of habit.
At the time of publication, Garner had no positions in any securities mentioned.