Will the Market Ever Pull Back?
Let's review the sentiment indicators and see.
You've reached your free article limit
You've read 0 of 1 free Pro articles.
I began this week on my soapbox with a discussion about sentiment. I insisted the American Association of Individual Investors’ (AAII) weekly survey last week was not representative of sentiment. It showed more bears than bulls.
To recap, I noted the Investors Intelligence survey did not show more bears than bulls. The National Association of Active Investment Managers (NAAIM) had their exposure at 98, just shy of 100. And the put/call ratios had their moving averages falling off the bottom of the page.
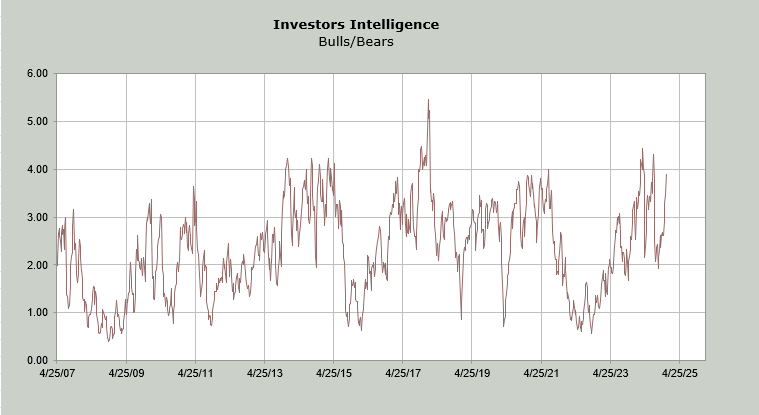
Let me add to it now. The Investors Intelligence bulls chimed in at 62.9%. Yes they were higher in July, at 64.2%. But I think we can all agree that 62.9% bulls is high.
The bears are now at 16.1%. In July they were at 14.9% so here too, we are not as extreme as July, but can we all agree that 62.9% bulls and 14.9% bears in no way resembles more bears than bulls?
In fact, when we do a bull/bear ratio we get 3.91. That means there are nearly –but not quite—four bulls for every bear. In the past a reading over 4 for this survey has signaled a correction in the market is close at hand.
We will see the NAAIM exposure on Thursday but I assume it is more apt to be higher than lower. And if it is over 100 that means folks are now are margin. Again, does that speak of more bears than bulls?
The put/call ratios have not gotten extreme in that we haven’t had a one day reading of say, the total number in the 60s nor have we had an equity only reading in the 40s since before Thanksgiving. But the moving averages are low, although not as low as they were in January 2021.
Then there is the Daily Sentiment Index (DSI). Both Nasdaq and the S&P are now at 85. As a reminder, over 85 and we have a yellow flag. Over 90 and it’s a red flag. The last time the DSI for both Nasdaq and the S&P got to this level was mid July (Nasdaq tagged 86 and the S&P tagged 85).
Then there is the VIX which you may have noticed was green on Wednesday. How can that be you may wonder? I don’t have the answer and I have looked at studies which say a green VIX on a big up day tells us very little. But I think it gives me confidence in my call for a bout of volatility next week.
However the DSI for the VIX is now at 11. The same way a reading over 85 is a yellow flag, a reading under 15 is a yellow flag. A single digit reading is a red flag. The DSI for the VIX in July was 10.
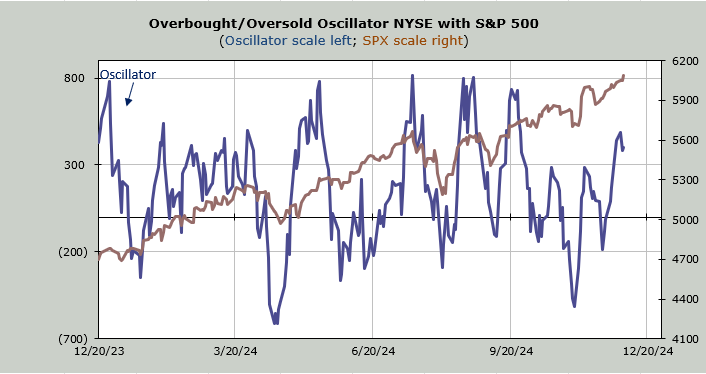
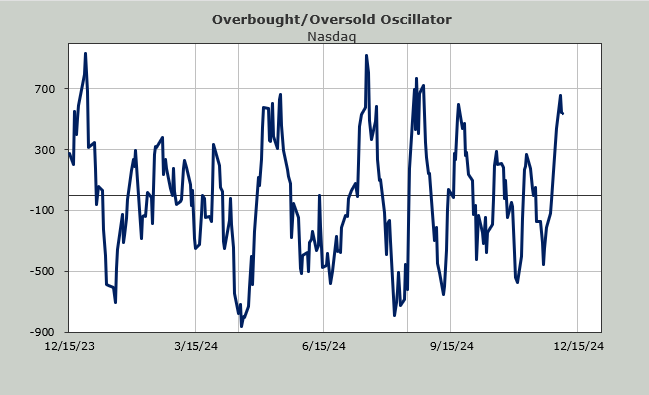
So that’s the sentiment summary. And if we combine that with the upcoming overbought condition (end of this week) and the poor breadth this week (breadth was flat on Wednesday) then I hope you can see why I think we are due for a pullback and/or a bout of volatility in the next week.
Or maybe the market is never going to pullback again. It feels that way, doesn’t it?