Whatta Week! Fed Phraseology, Trending Charts, Week Ahead, Trading Lockheed
While running with the bulls makes sense, there is no telling just how fragile any conviction in higher prices really is from this point on.
You've reached your free article limit
You've read 0 of 1 free Pro articles.
That was one heck of a week. All of the major and mid-major equity indexes were strong as were Treasury debt securities. The primary catalyst for these moves was the results of an FOMC policy meeting that culminated on Wednesday, along with the committee's quarterly economic projections and the Fed Chair's press conference.
While I won't complain as a trader/investor running what are primarily net long portfolios, as an economist, it's not too difficult to understand that something just feels wrong.
Was it the underwhelming official statement that was really little more than another "cut and paste" job, only more so than usual. The only change made to the statement came in the first part of the second sentence of the first paragraph. The phrase... "Job gains have moderated since early last year but remain strong." was edited to read simply as... "Job gains have remained strong." So, the statement's outlook on labor markets was both simplified and strengthened.
There was absolutely no hint of any increased level of concern over rising consumer and producer level inflation expressed anywhere in the statement despite 2024 pricing trends that are certainly causing some alarm among the populace.
The rally across financial markets last week was really provoked by the FOMC's aggregate economic projections. It's clear that the membership of the committee sees economic activity as heating up and not cooling off. That means they have committed themselves for some reason, to following GDP, which has been strong and ignoring GDI, which has been weak.
Every economist worth his or her salt knows that when GDP and GDI are not close, as they measure the same economic activity, that the two are supposed to be averaged. Apparently not these economists and no one in DC. The new rule seems to be that when the two measures of economic activity/growth are in contrast, simply go with the one that appears more optimistic and ignore the other. We've seen this same behavior across the financial media, especially when it comes to labor-focused data.
For stocks and for treasuries, last week was about the Fed Funds rate or the infamous "dot plot." The committee left their median projection for 2024 where it was, at 4.6% or about 75 basis points lower than it is now. Now, if one goes through the plot dot by dot, the average is moving higher, towards perhaps 50 basis points worth of rate cuts this year from the 75 basis points that are the median projection. That was enough for the algorithms that now control price discovery across all financial markets. The race was on.
Marketplace
Both the S&P 500 and Nasdaq Composite set all-time records on Thursday. The S&P 500 saw its four-day winning streak end on Friday, as the market's broadest large-cap index closed down small. However, the Nasdaq Composite was able to post by the slimmest of margins a fifth "green" daily candle for the week on Friday, completing the clean sweep and setting yet another record.
The S&P 500 gained 1.65% for the past week and is now up 9.74% for the year with just four trading days left in the first quarter. The Nasdaq Composite is up 9.44% year to date after gaining 2.85% last week.
Among narrower or more specialized indexes, the Dow Transports ran for a gain of 3.85% last week and have now swung into the green for the year at +0.71%. The same goes for the small-cap Russell 2000. That index popped for a gain of 2.33% last week to go into the weekend up 2.22% for 2024. The Philadelphia Semiconductor Index regained its footing last week, sporting a run of 3.16% that put that index up a stunning 17.55 year to date as I said, with four sessions left in the first quarter.
For the week, among the eleven S&P sector SPDR ETFs, ten shaded into the green, led by Communication Services XLC and the Industrials XLI. Those two funds were up 3.47% and 2.91%, respectively as seven of these funds gained 1.4% or more for the five-day period. The REITs XLRE were the only fund among the eleven to close in the red at -0.4% for the week.
The Trend is Your Friend
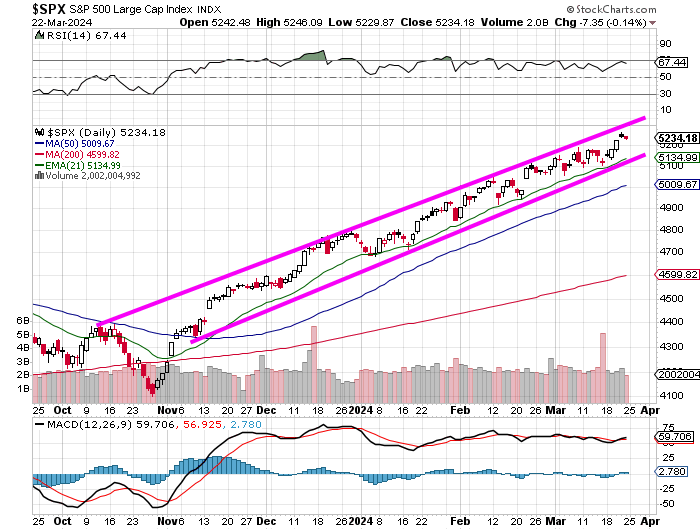
Helene Meisler has been sowing charts covering the recent trend in her column of late. I showed readers these two charts on Friday morning, and I think it's worth keeping them in our consciousness. Not only do they illustrate algorithmic control over price control as I am not sure that human traders as a group could have created such perfection in the trend along with such a narrow ascending range.
This range will break at some point. The amazing thing is just how well the 21-day EMA (exponential moving average) has supported the S&P 500 and how the 50-day SMA (simple moving average) really hasn't even been tested since early November.
That really means that professionally managed capital has not had its metal tested in aggregate in almost five months. While running with the bulls makes sense, there is no telling just how fragile any conviction in higher prices really is from this point on. See the one chart...
Now, see the other...
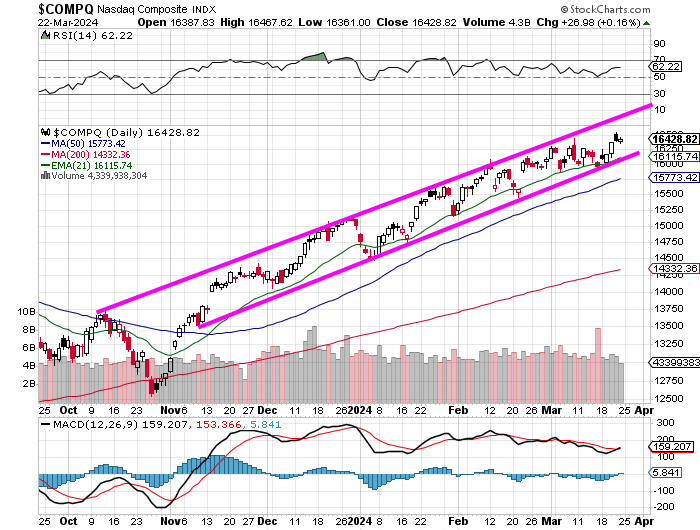
Readers will see almost the same song and dance for the Nasdaq Composite. The 50-day SMA has not been tested and contact with the 200-day SMA really isn't even a realistic consideration.
The Week Ahead
The week ahead is a holiday shortened affair with the oddity of perhaps the most important, market-impacting macro of the week due on Friday with the stock market closed for Good Friday.
Traders can look forward to Tuesday when the Census Bureau will release its February data for Durable Goods Orders. This will be enough to get the Atlanta Fed to revise its GDPNow model for the first quarter which is currently running at growth of 2.1% (q/q, SAAR). Atlanta will also revise their model on Friday, with markets closed. The BEA will release February Personal Income and Outlays that day along with February PCE and Core PCE inflation.
Other Federal Reserve regional district branches with running GDP models see Q1 at growth of 1.9% (New York), 1.33% (St. Louis) and 0.08% (Cleveland). Given that we currently stand in between two earnings seasons, there are just a few semi-high-profile names out there set to report this week and most of those report on Wednesday.
Come Tuesday, McCormick & Company MKC, and GameStop GME will report. On Wednesday, Cintas CTAS, Paychex PAYX and Jefferies JEF will all step to the plate, while Walgreens Boots Alliance WBA does so on Thursday. Not a lot of meat on those bones.
Trading
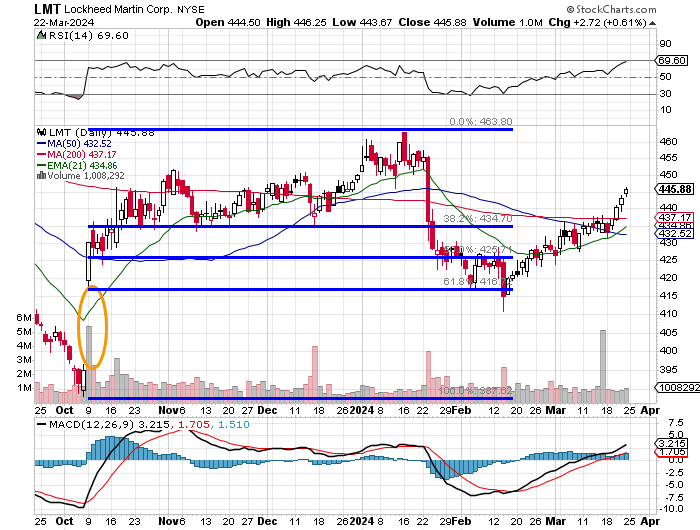
I showed the folks over at Doug's Diary this chart of Lockheed Martin LMT on Friday...
Late Thursday, the US Air Force disclosed that it had conducted the final test of an air-launched hypersonic weapon developed by Lockheed Martin. No information about the test or the results were released, and I would imagine, these results are classified.
Lockheed, for that matter, has added that the firm "can quickly deliver additional hypersonic-strike assets that can be rapidly deployed to the US military." As far as we know, the Air Force has not placed a procurement order for this weapon known as the Air-launched Rapid Response Weapon, or ARRW with Lockheed.
The Air Force already has in development, the Hypersonic Attack Cruise Missile (HACM), which is a collaborative project being worked on by Northrop Grumman NOC and RTX RTX, which is the old Raytheon Technologies. This is not a one or the other situation. The Department of Defense probably needs both if not weapons that can also be launched from both land and sea. This needs to be a priority.
This weekend, we also learned that the US and Japan are planning the largest upgrade to their security alliance since the two nations agreed to a mutual defense treaty back in 1960. The Biden administration is set to announce some details on this upgrade by April 10th. It may be key to note that Japan is a major participant in the F-35 Lightning II fighter program.
Concerning the stock, readers will note that LMT found support at the 61.8% Fibonacci retracement level of its October through January rally in mid-February and the stock price along with LMT's RSI (relative strength index) reading and daily MACD (moving average convergence divergence) have all looked much stronger since.
The stock, instead of filling that gap from last October, has now retaken its 21-day EMA, 50-day SMA and 200-day SMA, while the 21-day EMA has crossed over the 50-day SMA. That, in my admittedly biased opinion, is a bullish signal for swing traders.
Economics (All Times Eastern)
10:00 - New Home Sales (Feb): Expecting 677K, Last 661K SAAR.
10:30 - Dallas Fed Manufacturing Index (Mar): Expecting -8, Last -11.3.
The Fed (All Times Eastern)
07:25 - Speaker: Atlanta Fed Pres. Raphael Bostic.
10:30 - Speaker: Reserve Board Gov. Lisa Cook.
Today's Earnings Highlights (Consensus EPS Expectations)
No significant quarterly earnings are scheduled for release today.
At the time of publication, Stephen Guilfoyle was long LMT, NOC equity.
