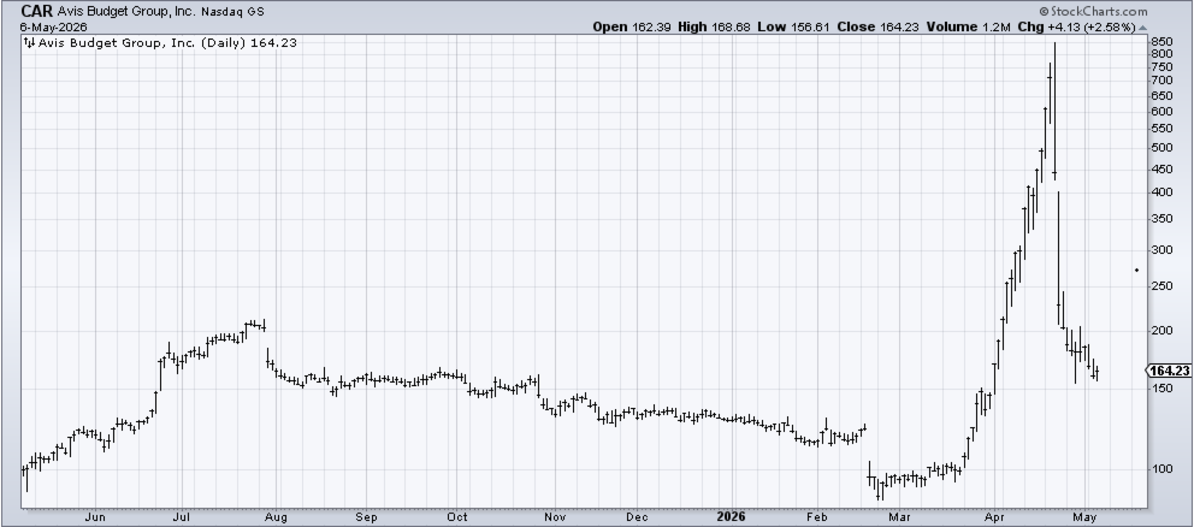
Have the SOX Gone Parabolic? Not Compared to Avis.
The SOX are strong. But this isn't the kind of melt-up that we saw recently with AVIS.
You've reached your free article limit
You've read 0 of 1 free Pro articles.
The Market
Let me begin by clarifying my comments yesterday on the SOX, since there were so many questions. I don’t love the chart here. I hate it. It’s not my style to chase something that is so high and grossly overbought. But what I have found is there are far too many who are keen to call every move we get a bubble, a melt-up, a crash, and now, a parabola.
You want to see a parabolic move? That move we saw in Avis (CAR) a few weeks back was parabolic. The entire move, up 8x, was done in a matter of weeks. It doubled in a week. One week!
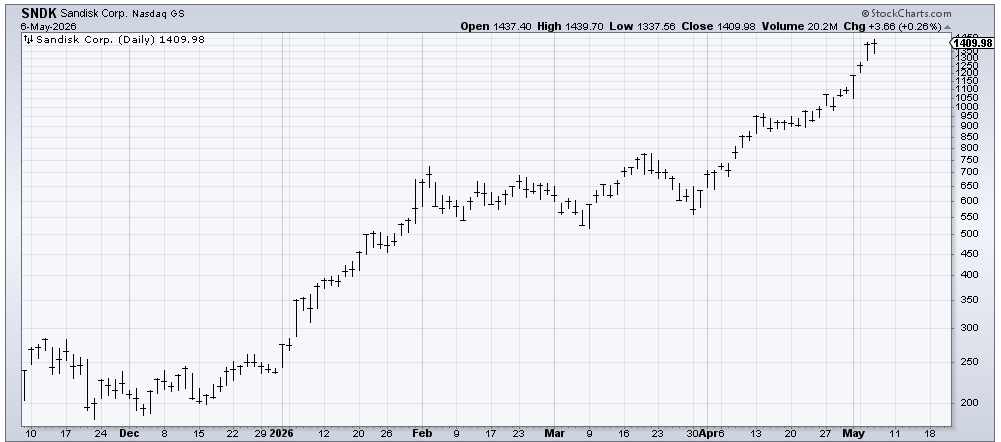
Again, Sandisk (SNDK) is not my kind of chart, and it is up a ton in the last few weeks (40%), but I hope when you look at the two charts, you can see the difference.
Now let’s talk sentiment. The move today took the DSI for Nasdaq to 84. If you want to extrapolate that to the semis, then the SOX is at 84 as well. Oh, maybe it’s higher, but that’s guessing. And 84 is knocking on the door of giddy. As a reminder, 85+ and I think we’ve stepped a toe into giddy. Over 90 and it’s a red light.
Then there is the put/call ratio, which came in today (preliminary) at .63. The last time we saw a reading that low was late January 2021, the height of SPAC-mania and the Roaring Kitty nonsense.
The ISE equity call/put ratio was 2.89. Readings over 3.0 have typically been bearish. You might recall we got that reading of 3.05 in mid-January of this year.
As for the statistics, breadth was not great; it was okay. In fact, net breadth was better on Tuesday than it was on Wednesday. The NYSE saw 61% of the volume on the upside. And the VIX closed green. Citibank closed red, which is really odd. The VIX DSI pushed down to 23, so if we get much more on the upside in stocks, that ought to go to a reading in the teens.
My notes have said that, come mid-May, I expect us to get intermediate-term overbought. I still have that penciled in on the calendar. The exact day should be considered an area, and not exact, but one week from today (Wednesday) is the day.
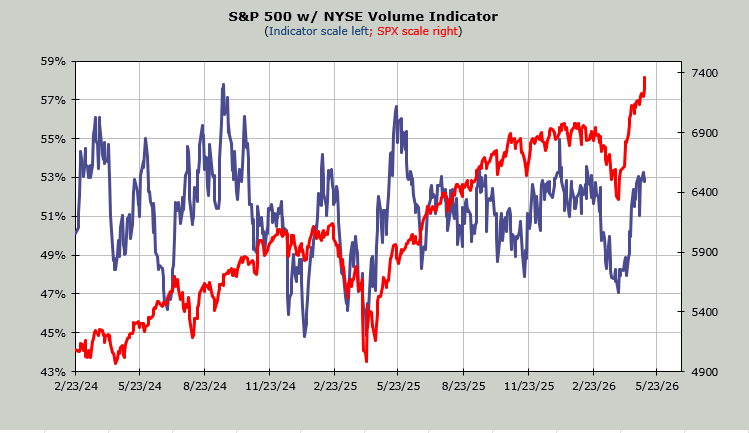
The Volume Indicator (shown below) is currently at 53%. If this rally can keep on going for a few more days, that indicator ought to tag 55% or more, which would mark this indicator as overbought.
If the rally can keep going a few more days, the DSI for Nasdaq ought to get over 85 and the VIX DSI into the teens. I have also noted that the put/call ratio for the VIX has been under .20 twice in the last week, usually a sign the VIX is about to ‘rally’.
I believe in the next two weeks we will see a bout of volatility.
New Ideas
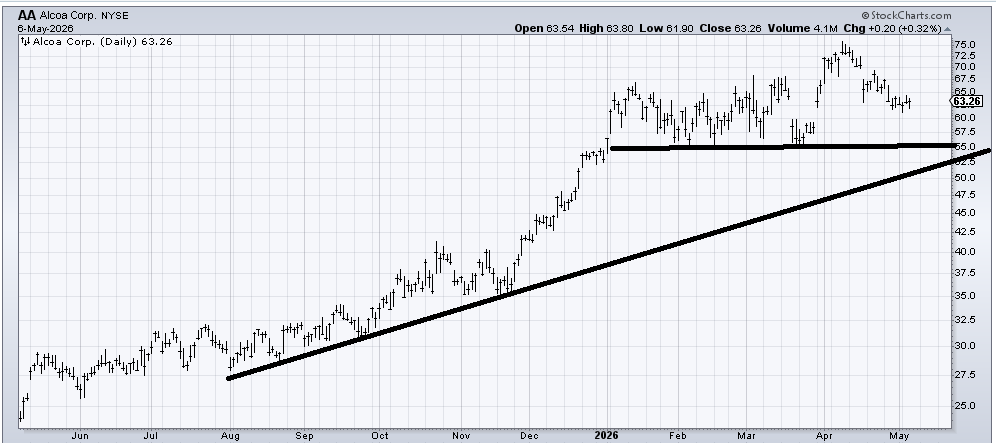
We had a great trade in Alcoa (AA) from mid-year last year through January, and I promised that if I thought at some point we should take a look at it again, I would follow up. If, over the next few weeks, Alcoa can hold over 55, preferably filling that gap near 60, I think it will start to shape up again.
Today’s Indicator
The Volume Indicator is discussed above.
Q&A/Reader’s Feedback
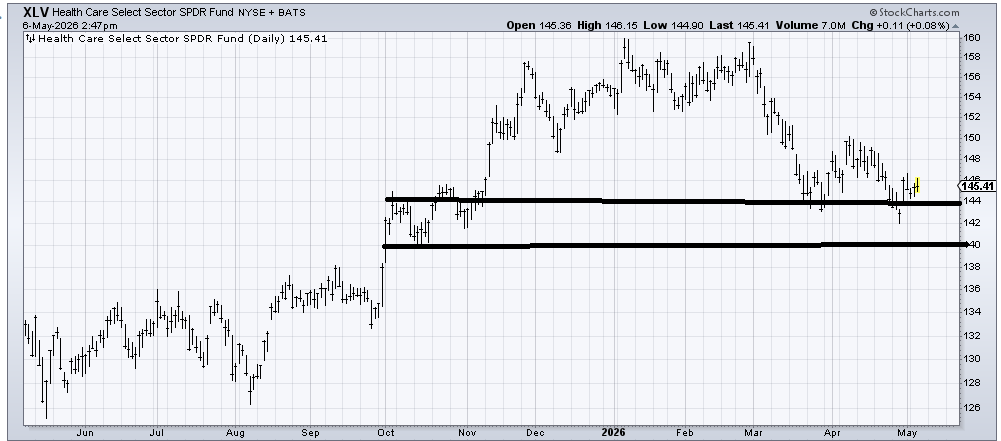
(XLV) , an ETF to be long healthcare, looks pretty droopy to me. But I look at it, and that plunge to 142 followed by a recapturing of 144 has my interest. It might be too soon to get excited over the chart, but when it got to the low 140s, it hit the measured target from the top it broke down from. I’d say if you have some patience, it might be worth a nibble, but leave some room in case it revisits that 140-142 area.
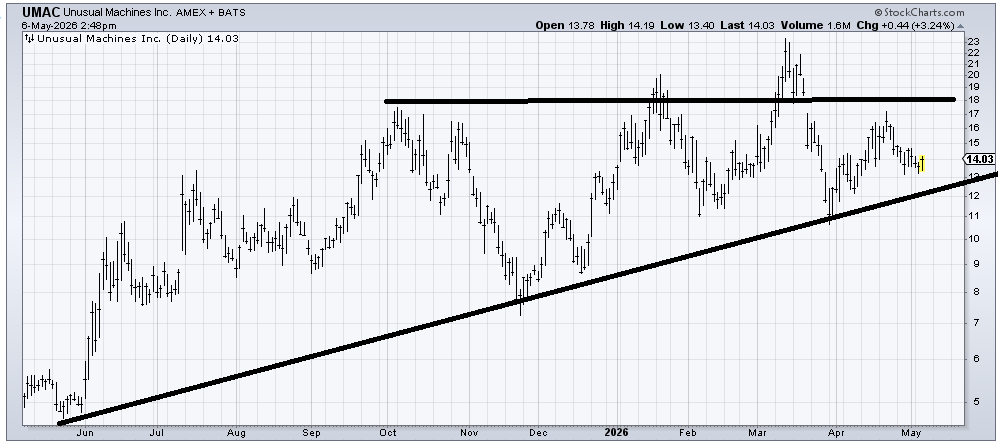
Unusual Machines (UMAC) hasn’t gone anywhere in nine months. As long as it stays over 11-12 it should get the benefit of the doubt. If it slips to 12, the risk/reward is better (obviously)
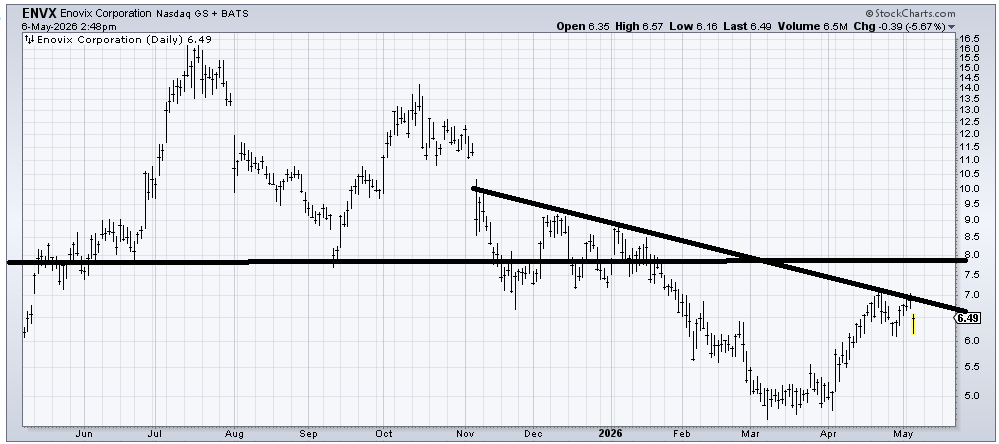
Enovix Corp (ENVX) has some work to do, so unless it does more sideways action or gets up and over 7, I’m inclined to think it will do more to frustrate than anything else. Getting over 7 would be the first step in improving.
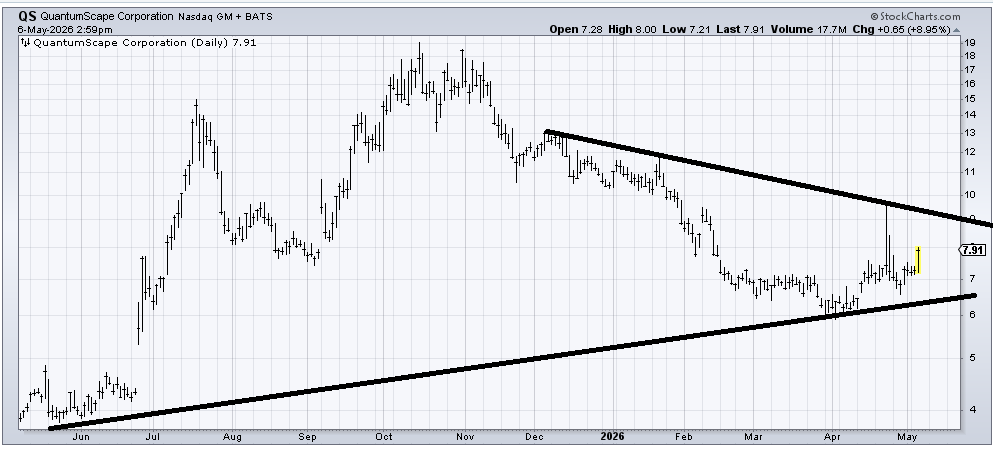
QuantumScape (QS) is one of those low-quality stocks that has a chart that screams at me as a bottom fisher. It ought to be able to get to that spike high from a few weeks ago. Note that earnings are out next week.