Are Small-Caps Poised for a Serious Run?
Let's answer that question in light of all the market chatter and considering what's going on with bonds.
You've reached your free article limit
You've read 0 of 1 free Pro articles.
Sometimes I wish there was a Daily Sentiment Index (DSI) for the Russell 2000. Oh don’t worry, I don’t think it would be up in the 80s or 90s, but the way the chatter has picked up I’d say it would be high and getting higher.
In the last week or so almost everywhere I turn someone is saying "No growth, value" or ‘Large-caps need a rest, small-caps should do well going forward." Or then there’s the guy who says the Russell should rally by 50%, although I did not see him give a time frame.
This is in sharp contrast to what we heard a month ago when the Russell was hovering below 2000 and couldn’t get out of its own way. A month ago we heard how many unprofitable companies there were in the Russell so surely it was not the place to be. So what changed? Aside from price, that is!
The only thing I can think of is that folks seemed certain interest rates were back to "higher for longer" and after the FOMC last week they are not so sure of that view on bonds. But if better bonds (lower interest rates) are good for small-caps then why did bonds rally (rates down) on Friday and small-caps got clocked? Once again, it is pretty clear I should stay away from narratives because I can’t seem to figure them out.
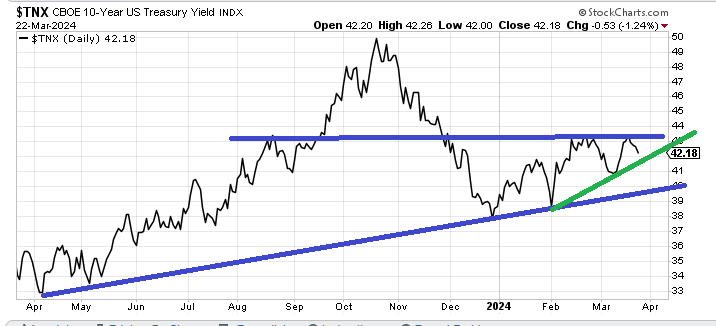
Let‘s start with bonds. You may recall I have been in the camp that thought for the most part we were in a trading range. I thought rates were going up in early February and then down once they got to 4.20-4.30% in late February. I got gun shy last week when they popped back to 4.30% because the last trip down did not get to the blue line, thus keeping that range intact.
But now we find ourselves coming close to that green line in the chart below (call it 4.15%-ish). If that green line holds it would be a higher low, and another chance we had to come back to the bottom of the range (blue line) and couldn’t. Typically that means the upper blue line will be breached.
For now my view is still we’re in a trading range on bonds (blue lines) but holding that green line and rallying rates could change my view.
And the IWM chart? It has a nasty habit of false breakouts. Just look at late December when it popped after the FOMC meeting and then gave it all back in January. Or two weeks ago when it popped to $210, finally getting over $205 only to turn south to $200.
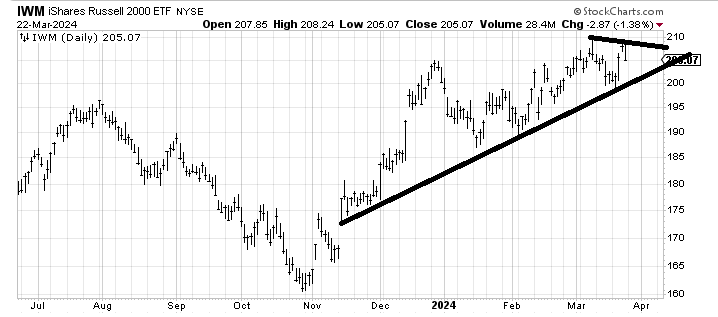
The IWM doesn’t have the same channel lines as the big-cap indexes but it has this solid uptrend line we’ve looked at several times. If the IWM can hold over this $205 area (and thus not come down and tag the uptrend line) it would indicate strength. Otherwise, that uptrend line is still in play.
Note: A major change occurred with the put/call ratios on Friday. I discuss it in detail in the latest Top Stocks.
