A Head-Scratching Change Just Happened to One Market Indicator: What's It Mean?
Something unusual changed in the options ratios on Friday and we need to be aware of it. Let's also look at the potential for a rally in the Russell, gold, two China ETFs and more.
You've reached your free article limit
You've read 0 of 1 free Pro articles.
The Market
There seems to be a growing contingent of market participants who think the Russell 2000/small-caps are set to rally in a very serious manner. I will grant you that if bonds can rally hard, the small-caps should as well, but Friday bonds rallied and small-caps got smashed.
Statistically speaking, Friday looked mostly like giveback from Thursday’s rally. For example, Thursday the net advance/decline line on the NYSE was +1,024 and Friday was -920. Net volume (up minus down) on Thursday was +1.1 billion shares and Friday was -1.7 billion shares. Yet the yield on the 10-Year is back to 4.2%.
Did it change any of the indicators? It did not.
The only indicator worth noting, and only because it was so different than what we’ve seen, was the put/call ratio. Let me note that I rarely discuss this indicator anymore because it has literally flat-lined for the last few months. It seems to hover either side of 0.90. Once in a while we get a reading over 1.0 and sometimes we get down to 0.80 but mostly it sits around 0.90. This is very unusual.
Yet on Friday the total put/call ratio surged to 1.29. Wow. It was not seen in the equity portion as that was 0.65, also pretty much where it has hovered for the last few months. It was all in ETFs and the Index. The ETF put/call ratio surged to 2.38. To put that in perspective, it is the highest reading since October 4. And prior to that, late December 2022!
Could it be end-of-the-quarter positioning? I guess. But I don’t like to rationalize an indicator. Something changed in the options ratios on Friday and we need to be aware of it. If the market had been pushing lower for weeks it would make sense but up here it makes little sense.
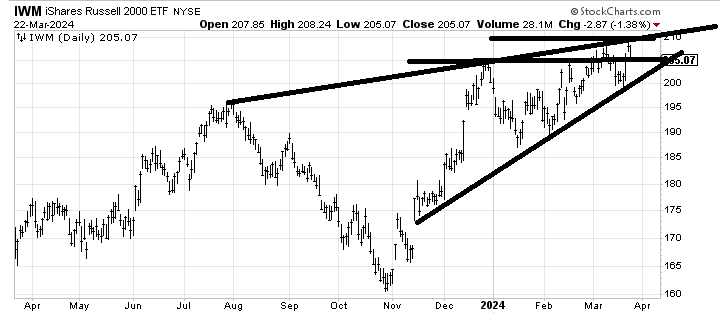
But back to the iShares Russell 2000 ETF IWM and the small-caps. The IWM has a nasty habit of breaking out and dying. Just look at the push up in late December that quickly gave it all back and more in early January (see below). Two weeks ago everyone was certain that move over $205 was "it" and immediately we fell to $200.
The IWM’s lines are different than the S&P 500’s lines, there is no channel there. But as we have discussed that uptrend line has been solid. For this to be really bullish I would say $205-ish needs to hold because that would mean for the first time the chart is not taking a trip back to the uptrend line.
Otherwise, as long as the uptrend line remains intact, this is just what it has been: a lethargic climb.
New Ideas
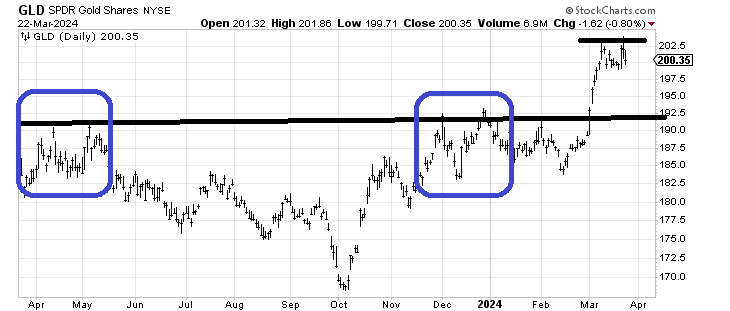
A few weeks ago when SPDR Gold Shares GLD rallied to $202 I noted that there is a measured target higher around $210. It has failed to achieve that level on the subsequent rally. I noticed this weekend that GLD has a habit of creating that pattern. I have highlighted it with the two blue boxes on the chart below. The main difference is that those were all at resistance. But if GLD breaks last week’s low I’d have to say a trip back down to that black line is not out of the question.
Today’s Indicator
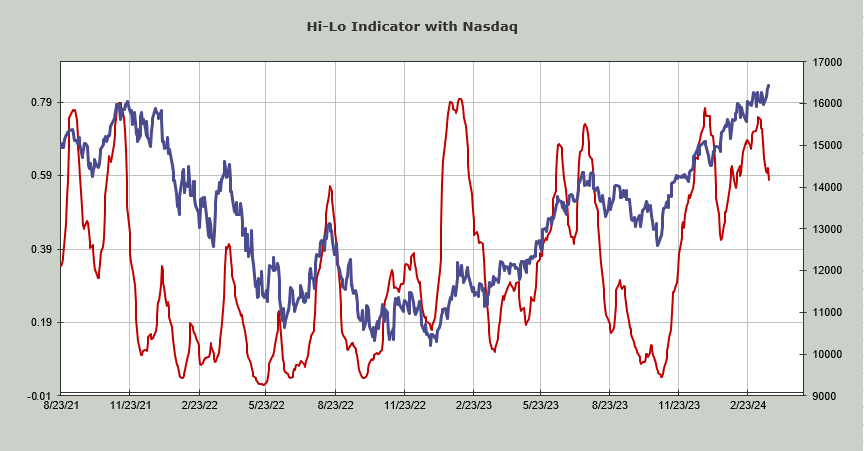
The Nasdaq’s Hi-Lo Indicator is still heading lower. If the Russell is going to rally, this is going to need to turn upward.
Q&A/Reader’s Feedback
Helene welcomes your questions about Top Stocks and her charting strategy and techniques. Please send an email directly to Helene with your questions. However, please remember that TheStreet.com Top Stocks is not intended to provide personalized investment advice. Email Helene here.
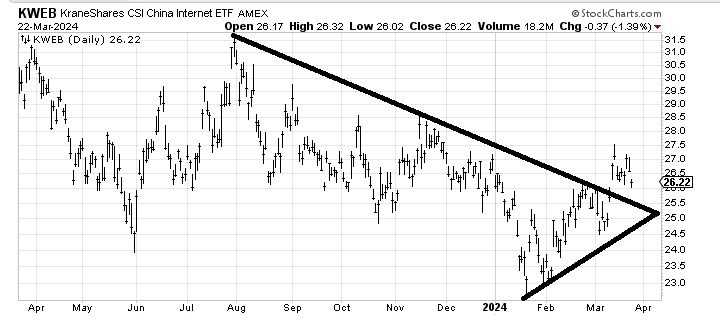
KraneShares CSI China Internet ETF KWEB continues to attempt building a base but all that resistance is going to take a long time to eat through. I would like to see it come back into that $24-25 area and hold that area before it attempts another push upward. Just place your hand over the left side of the chart below and imagine how many months it will take to eat through that resistance. It’s a start with higher highs and higher lows since January but it’s a process.
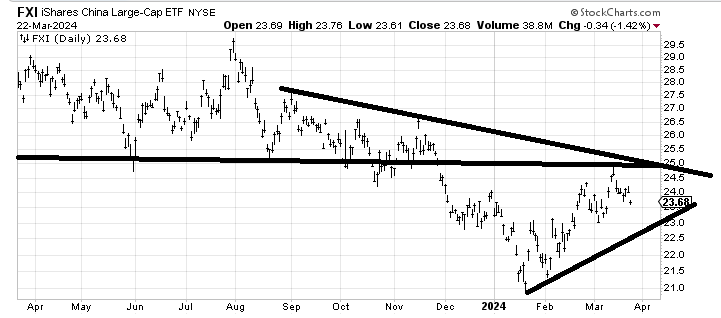
iShares China Large-Cap ETF FXI also has a lot of resistance to eat through. It has done an admirable job getting to resistance but it ought to have a trip back down. Resistance shows us where the sellers are. Support shows us where the buyers are. A trip toward $22-ish will tell us if those buyers show up again. It ought to take months to eat through the resistance with ups and downs.
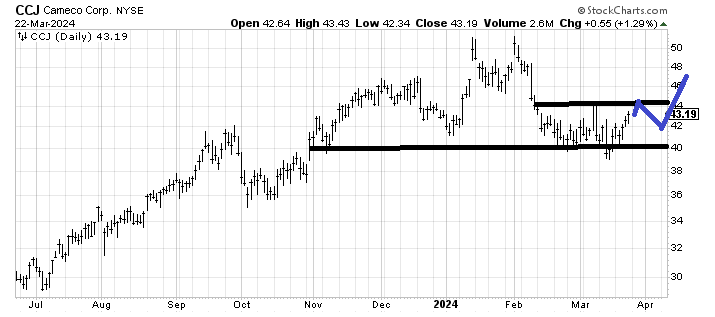
I was asked if I still like Cameco CCJ and the answer is yes. I liked it on the trip down to $40 a few weeks ago. I think $44 is going to be some resistance, though. I would like to see a pullback toward $42-ish that holds and then pushes upward again. I have drawn it in blue.