What's Going on in the Market? Slowing Economy, Trading AMD and Lilly
Don't worry. The economy's strong. Someone on TV just said so.
You've reached your free article limit
You've read 0 of 1 free Pro articles.
Somethings going on...Or not. The seemingly endless barrage of headline level economic data has not let up. Of late, most of those data-points have tended towards disappointment. There have also been downward revisions made to many past reports of several series. This had given a rebirth of sorts to the recent upswing in market prices for risk assets.
Is this due to a slight slowdown in some inflation-related data as the media would have one believe? Is this recent surge more than likely due to weak macroeconomic performance as I have suggested in this column. Both ideas end up in the same place, or work together to do so, which is to allow the FOMC a little more optionality in the determination of short-term interest rate policy.
Perhaps, financial markets have simply been pricing in the same inflation that we have seen over the past three years or so in housing markets or across the general economy. Perhaps equities even have to catch up, as the market is less expensive relative to earnings expectations now than it was during the late March into early April peak?
One will only know these things for sure in hindsight but understand all three disciplines.... are still at play here. Understanding the economic backdrop that both front runs but is also shaped by policy is key to the cognitive interpretation of the financial environment.
Beyond that, fundamental analysis determines the obvious. Do you have a direction? Do you have a vehicle capable of taking you somewhere worthwhile down that road? Finally, technical analysis has never been more accurate than it is now, in my four-decade long career. Thank the programmed algorithms for that. When I was much younger, we who could read charts were called "chart-monkeys" and mocked openly when we were wrong.
Now, as humans have largely been replaced by machines, by algorithms on Wall Street, it has become so much easier than it ever was to see where the bus stops are when a trade idea is working or even when it is not. Short-term trading is not easy. It never has been and there can still be the feeling of gambling when engaged.
That said, short-term trading has never been easier than it is now. There was once a time with no internet, with no computers. Traders charted (fewer stocks of course) by hand, in notebooks, with pencils. Erasers were a must. True story.
The Pause That Refreshes?
Equities took something of a break on Thursday. Well, not penny-stocks, but everything else seemed tired. The S&P 500 gave up 0.21% for the session, after peaking for the day about 90 minutes into the session. The Nasdaq Composite surrendered a similar 0.26%. Peaking at around the same time, closing near the lows. Nothing at the index level closed too far from where it closed on Wednesday, but pretty much everything closed in the red. Midcaps were hit the hardest with the S&P 400 down 0.85%. The Russell 2000 gave back 0.63%.
Of the eleven S&P sector SPDR ETFs, nine closed lower for the session, led lower by the Materials XLB and Discretionaries XLY, though neither gave up anything close to one percent. The Financials XLF closed unchanged, but interestingly, the Staples XLP soared on Thursday, gaining 1.42% after having been the laggard of the group for much of the past week.
As far as breadth is concerned, it's almost meaningless. Did I say "almost", I meant that the breadth was meaningless, at least for Nasdaq-listed names. Check this out... Losers beat winners at both exchanges. For NYSE-listings, advancing volume took a 43.2% share while aggregate trade finished 10% lower on a day over day basis. Not meaningful in our world. What happened to Nasdaq stocks on Thursday is indescribable.
Advancing volume for Nasdaq-listed names took a commanding 84.4% share, while aggregate trade was up another 40% day over day. Aggregate trade for Nasdaq-listed securities reached more than 11.9B shares. As Helene Meisler pointed out in her nightly column last night, Thursday was the most active day in composite Nasdaq-listed trading history. Helene pointed out that three stocks that all trade on the Nasdaq, two of them penny-stocks, accounted for roughly 6B of the almost 12B shares traded.
Rev Shark DePorre pointed out in his evening column that according to Goldman Sachs, at one point on Thursday, something like 45% of total volume had been in stocks that trade for less than $1. The daily average is 12%. Hmm.
Speculation running amok? Mass coordinated market manipulation? Something that has nothing to do with trend or market health is going on. The financial media seems to be sleeping on this story, which is obviously a big deal.
Instead, the financial media focuses on the 40K level for the Dow Industrials, which is no longer a major equity index, has not been a major equity index for 30 years and is literally tracked by very close to no capital. Possible market manipulation under the noses of a blatantly sensationalist financial media. Incredible.
Take a Look...
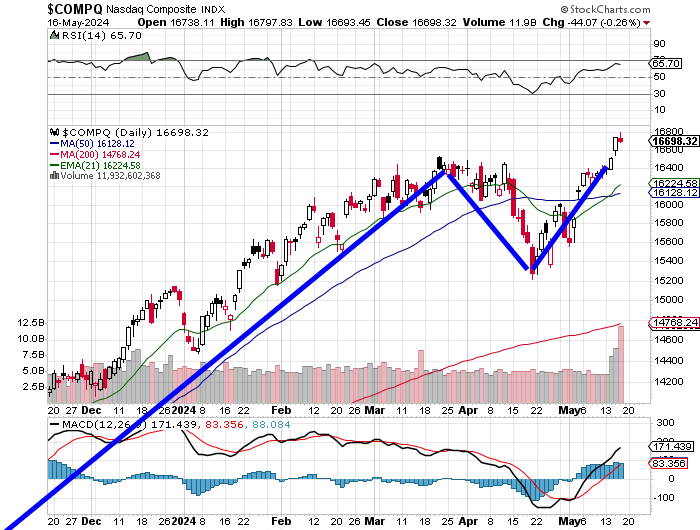
One... we have to ask ourselves if a double top reversal is still in play? Or at least a basing period of consolidation? Before you move on, just look at the past three days of trading volume across the Nasdaq Composite. 84% "up" volume on a "down" day, overwhelmingly in penny stocks. Seems legit.
The Economy Continues to Slow
On Thursday morning, the Census Bureau released April Housing Starts and Building Permits. That's not all they did. Seasonally adjusted estimates of housing units authorized by building permits have been revised back to January 2017, while seasonally adjusted estimates of housing units authorized but not started, started, under construction, and completed have been revised back to January 2019.
While it would be easy to poke some fun at the agency here, this is actually commendable. Records known to be inaccurate need to be corrected. Psst... Bureau of Labor Statistics... you need to get on this, like pronto. We all know your numbers are close to worthless.
April Starts printed at a seasonally adjusted and annualized 1.36M, up 5.7% from the downwardly revised March estimate of 1.287M. With the revisions, March 2024 was down 16.8% from February and is now the worst month for housing starts since the Covid lockdowns. April permits crossed the tape at 1.44M (SAAR), down 13% from March and down 2% from April 2023. Single family permits of 976K (SAAR) were the fewest for any month since last August. Multifamily permits of 408K were the fewest for any month since October 2020.
Don't worry. The economy's strong. Someone on TV just said so.
About 45 minutes later, the Federal Reserve released April Industrial Production. The headline print crossed the tape flat (+/- 0.0%) from March, and that was a March that was revised from +0.4% m/m to just +0.1% m./m, so this is really two months of almost no gains for this data-point.
Even worse, when broken out, Manufacturing Production for April printed at -0.3%, while Mining Production hit the tape at -0.6%. The headline print was rescued by the Utilities that posted a month over month production gain of 2.8%. Capacity Utilization dropped to 78.4% in April from 78.5% in March, as the Utilities once again rescued the number from significant declines in utilization across manufacturers and miners.
After all was said and done, the Atlanta Fed was forced to revise its GDPNow model for the second quarter lower for a second straight day. Atlanta took its running estimate for Q2 GDP growth down to 3.6% from 3.8% (q/q, SAAR). The next revision is set for a week from today, May 24th after the Census Bureau releases April Durable Goods Orders. Really, I look forward to the Q2 GDP estimate updates to be provided by the St. Louis and New York Feds this weekend. Both have been more accurate than Atlanta this year, St. Louis especially so.
Trading
- I have completed my exit from my long position in Eli Lilly LLY. The trade was based on the expected success of the GLP-1 diabetes/obesity drugs and had served its purpose with a very large win for the book. The space is becoming increasingly crowded with competition not just from the established Novo Nordisk NVO, but also expected to come from a number of other players currently in clinical trials such as Amgen AMGN, Roche RHHBY, and Viking Therapeutics VKTX.
- I have just started to add back to my long position in Advanced Micro Devices AMD. We had taken profits on a large chunk of this position as the shares had run into trouble earlier this spring. Not only did Wolfe Research replace Nvidia NVDA on the firm's "Alpha List" with AMD ahead of Nvidia's earnings next week (while remaining positive on both), but there is a little something going on technically in the trading of AMD. Take a look...
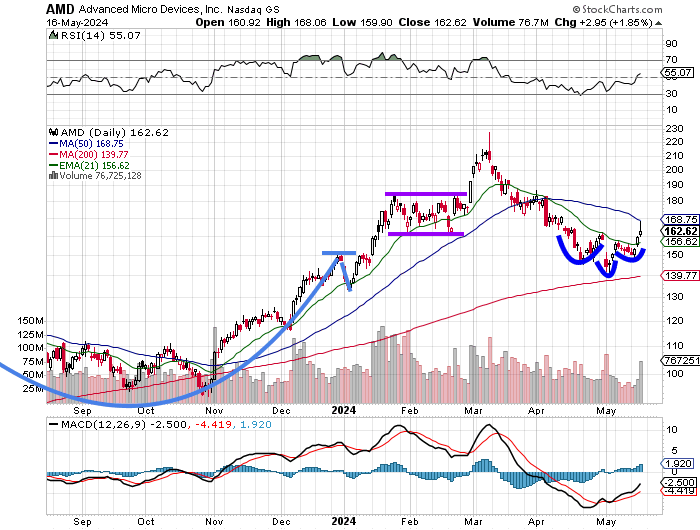
What's that? Do you see what I see???? Let's zoom in.
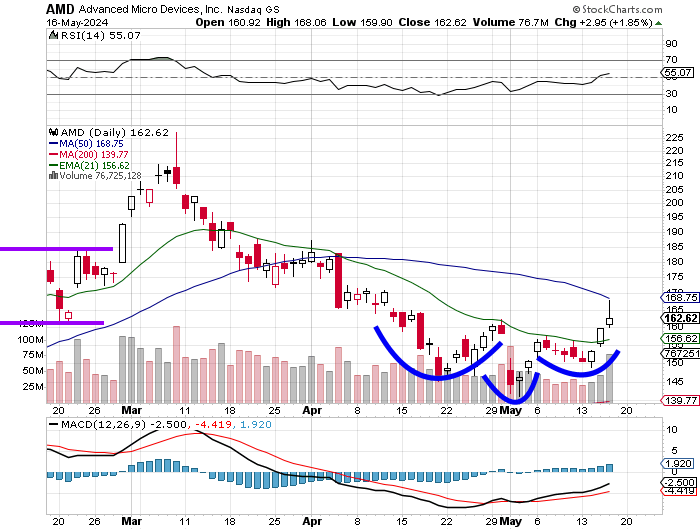
Improving relative strength, a daily MACD (moving average convergence divergence) with a bullish crossover of the 26-day EMA (exponential moving average) by the 12-day EMA, with the histogram of the 9-day EMA above zero and low and behold... a developing inverse head and shoulders pattern with a $162 pivot. Oooh-freakin'-Rah. Take and hold that pivot, I'm thinking of a new target price around $194.
Economics (All Times Eastern)
10:00 - CB Leading Indicators (Apr): Expecting -0.3% m/m, Last -0.3% m/m.
13:00 - Baker Hughes Total Rig Count (Weekly): Last 603.
13:00 - Baker Hughes Oil Rig Count (Weekly): Last 496.
The Fed (All Times Eastern)
10:15 - Speaker: Reserve Board Gov. Christopher Waller.
12:15 - Speaker: San Francisco Fed Pres. Mary Daly.
Today's Earnings Highlights (Consensus EPS Expectations)
Before the Open: ROLL (2.35)
At the time of publication, Stephen Guilfoyle was long AMD and NVDA equity.
