Times of Change
Let's review the recent shifts in the market, looking at Nasdaq's round trip, sentiment, the indicators and more.
You've reached your free article limit
You've read 0 of 1 free Pro articles.
The Market
Let’s review what changed in the market this week.
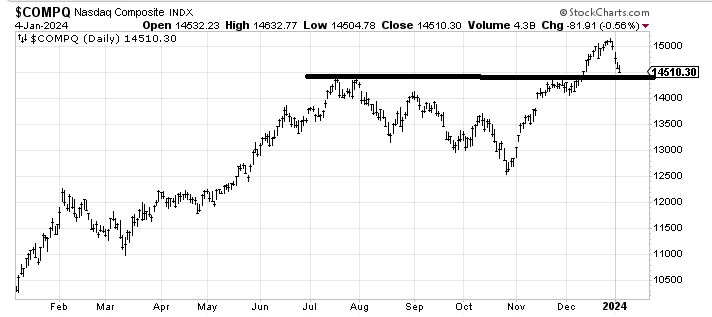
First of all, Nasdaq has been red for five-straight days, something it hasn’t been since October 2022. That is a change. It is also a change that the Nasdaq made a round trip -- from the close of 14533 the day before the Fed shifted its view (did they?!) in December, to today, when it closed at 14510.
The indicators rolled over: the McClellan Summation Index, the Hi-Lo Indicator, the Volume Indicator, and the 30-day moving average of the advance/decline line.
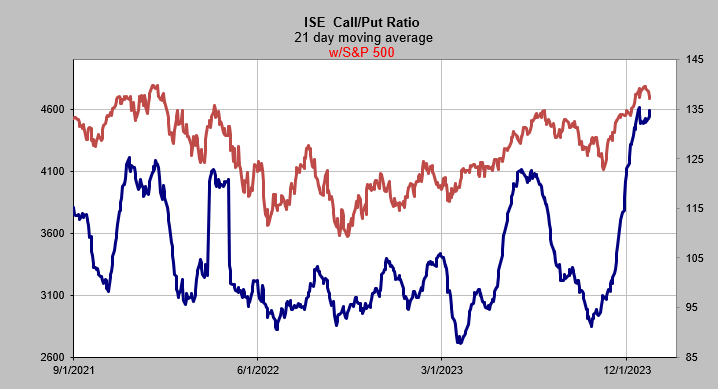
But there’s also sentiment. The Investors Intelligence bulls ticked up while the bears ticked down. The American Association of Individual Investor bulls ticked up and the bears ticked down as well. The International Securities Exchange's call/put ratio’s 21-day moving average rolled over. I believe it is in the process of doing a "double tap" before it heads back down again. The chart is below.
National Association of Active Investment Managers folks who had gotten their exposure up to 102 last week came down to 70 this week, so that’s a change for the better, although not extreme enough for me, just a step in the right direction.
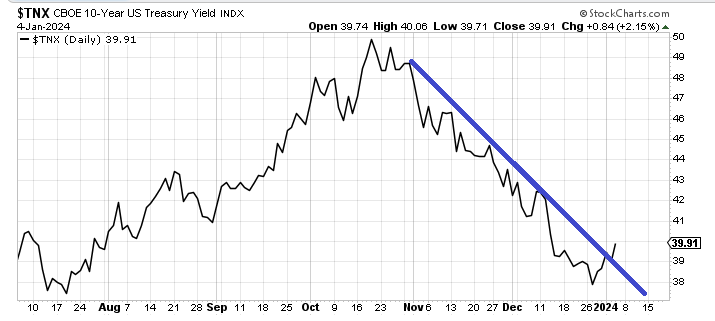
Let’s not forget the bonds. While I was on vacation I published that piece on how I thought rates were heading up for a while, having gotten overdone on the downside. So what changed this week is that the yield on the 10-Year crossed that steep downtrend line.
Here’s what didn’t change. Breadth is still hanging in there. The number of stocks making new lows has not expanded in a significant manner. Not yet. Most charts have not broken support. Take a look at Nasdaq. It is back to the breakout level. Really we should get a bounce from this 14500 area. I suspect unless/until that 14000 area breaks folks will not get terribly cautious.
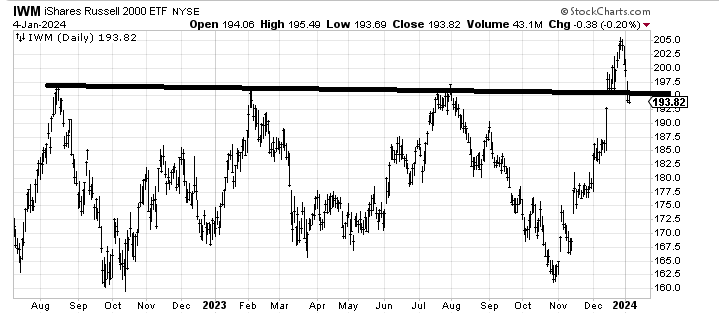
Then there is Russell 2000 IWM. Sure it came in under $200, which I will say isn’t the sign of a super strong market, but I was eyeing that gap as a spot it should bounce from and we are within a buck of it. Here, too, I would think there should be a bounce.
But I ask you to consider what I wrote yesterday. Over the course of a correction we should have bounces. Look at the August to October decline: we had a bounce in mid to late August, another tiny one in late September, and finally another one in early October. That is typical of the way a market corrects. I do not think this trip back down will be as extreme as the one we had last fall but I do expect it will take its time over the next couple months to get back to an oversold condition.
New Ideas
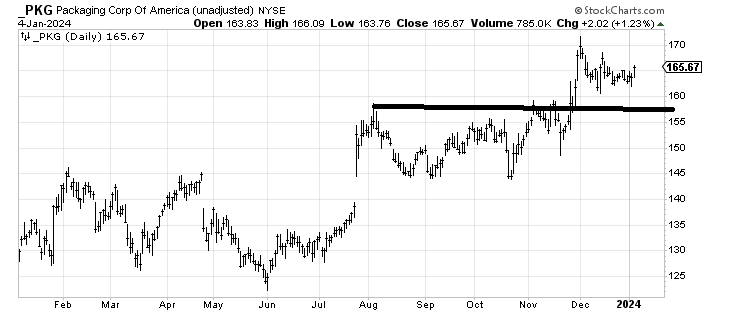
I have at times recommended Packaging Corp of America PKG and it had its correction in December. There is an unfulfilled target in that $175-$180 area. I do not want to see it back under $163, though.
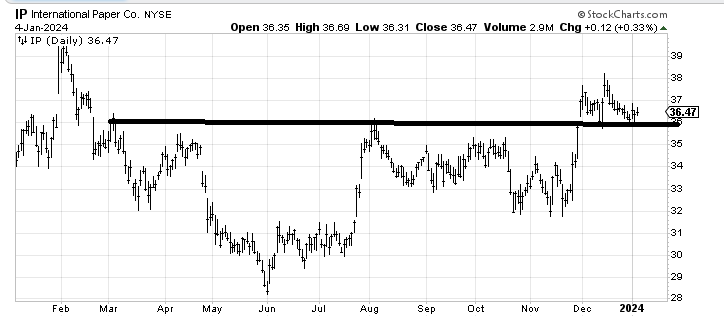
Then there is International Paper IP, which broke out of a big base and has now sat there. As long as this stays over $36 it should be OK. It too has spent the last six weeks consolidating/correcting.
Today’s Indicator
The ISE call/put ratio is discussed above.
Q&A/Reader’s Feedback
Helene welcomes your questions about Top Stocks and her charting strategy and techniques. Please send an email directly to Helene with your questions. However, please remember that TheStreet.com Top Stocks is not intended to provide personalized investment advice. Email Helene here.
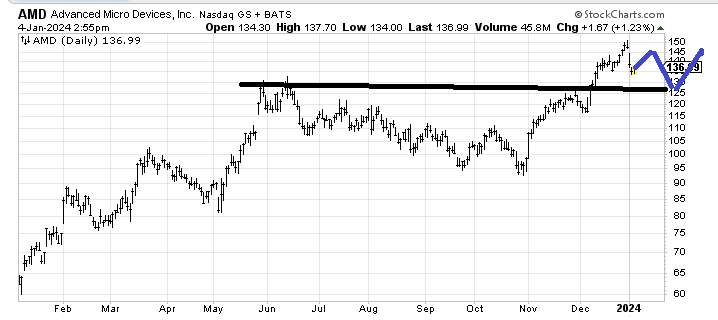
Lining Up AMD: Over the course of the next few months I would expect Advanced Micro Devices AMD to trade something akin to how I’ve drawn it in blue. I think this is a correction and typically they need time to play out and time to get charts back into shape. That’s how I think AMD should work out.
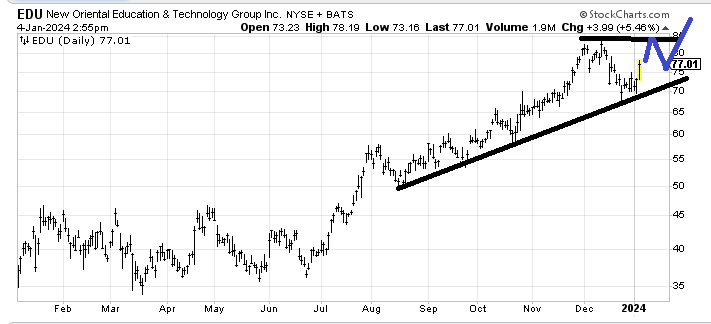
A Lesson in EDU's Chart:I would like to see New Oriental Education EDU map out something like what I have drawn in blue. I think it is too much to ask for it to breakout (over $85) on this run from $70. It ought to get near there, back off and then come through. Then the target would be near $100. If it breaks $70 I am wrong.
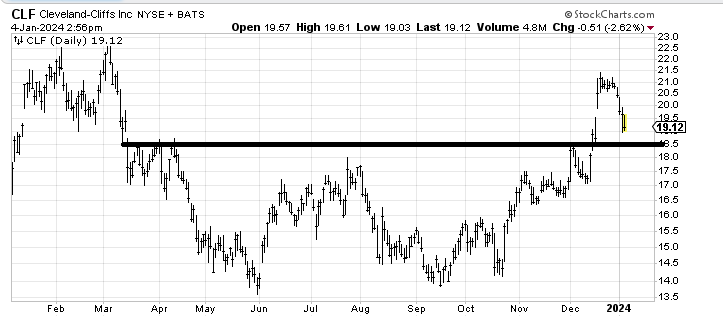
Can Cleveland Cliffs Climb? Cleveland Cliffs CLF should try and rally off $17.50-$18. But here again, I’d rather see it do some sideways work over the next month or so because a bounce off that support I believe would be just a bounce.
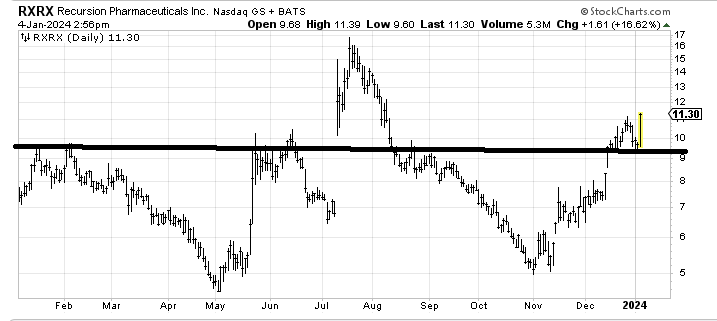
Recursion Risks Reversion Recursion Pharmaceuticals RXRX has an unfulfilled target around $14. But when it comes to health care, there is a big conference next week and it looks to me as if many of these stocks are running into the conference and therefore are likely to see a pullback once the conference gets started.
Disclosures: None.
