Time in the Market Matters. Until It Doesn't.
It seems buying leveraged single-stock ETFs and put option selling against the indexes has become mainstream. Never confuse genius for a bull market.
You've reached your free article limit
You've read 0 of 1 free Pro articles.
Most developed nations have seen their risk-taking rewarded with perpetually increasing stock prices. Of course, there have been drawdowns and even a lost decade or two, but the equity markets are designed to go up over time, and they have done exactly that.
As a result, the argument that timing the market is far less important than time in the market has always held. Yet, the basic principle of finance is still true: reward can only be possible with risk. Moreover, the relationship is sloped in a way that a higher reward is accompanied by higher risk.
Many market participants behave as if the outsized rewards investors have enjoyed are either risk-free or somehow not riskier than was the case at any other point in history. The infamous "Fed put" and aggressive legislative stimulus have intoxicated the financial markets with easy-money policies encouraging unhealthy risk-taking.
I could be wrong, but I'm relatively confident with this take; I speak to several retail traders in stocks and futures. It seems the practice of buying leveraged single-stock ETFs (mostly tech-oriented) and put option selling against the indexes has become mainstream, and, worse, participants believe their sophistication is the reason they have been able to use the market as an ATM. We have all done it, but must never confuse genius for a bull market.
Further, large funds are acquiring investment dollars for covered call strategies and zero-days-to-expiration option selling. These types of strategies have likely been performing well. Still, eventually, the law of averages will catch up with the outsized gains, causing some isolated pain if we are lucky, but systemic pain if the liquidation process gets messy.
Higher for Longer Is the Mantra in Treasuries, but Markets Are Full of Surprises
Almost everyone on business news stations expects higher equity prices and lower Treasuries (higher yields). If investing were as easy as jumping on the bandwagon along with everyone else, we would all be rich. The reality is that it isn't. In fact, markets have a sadistic habit of doing the opposite of what most expect.
This is likely because those with strong opinions about asset prices have generally already acted in their investment accounts. It's elementary, but it always proves to be accurate; when all of the bulls have bought, it is time to sell, and vice versa.
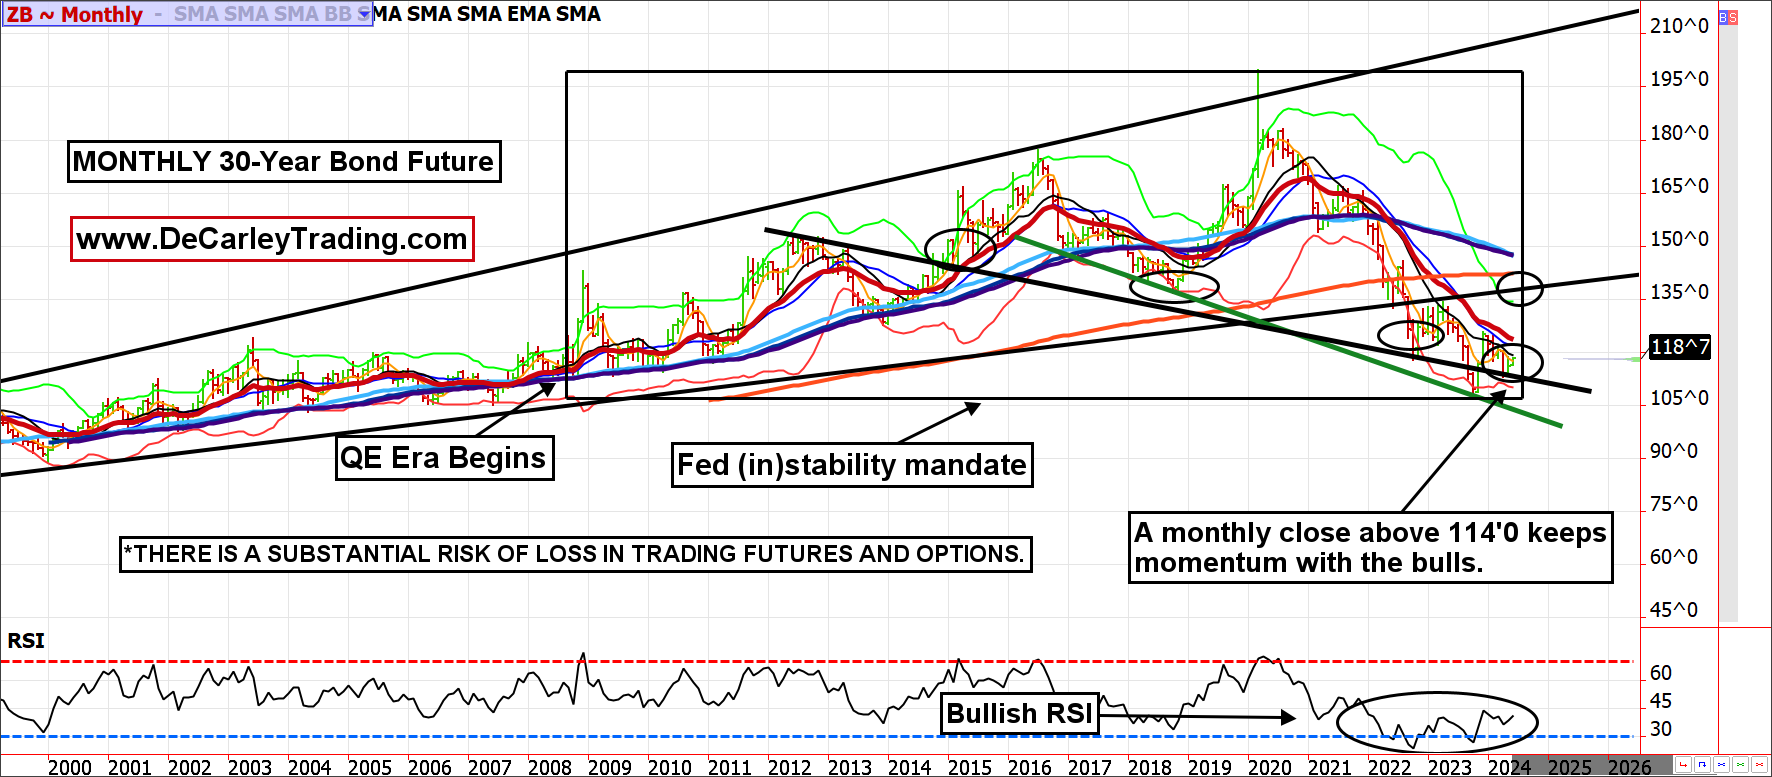
If we are right about the outsized risk in equities, being paid 4.5%, and maybe more if Treasuries actually rally, to wait is extremely attractive. Further, U.S. rates are still higher than sovereign debt in countries with similar credit risk. Eventually, that will matter.
Lastly, while the market is focused on inflation without concern for recession, the narrative has the potential to flip as it did almost 20 years ago, going into our last true recession.
Charts Matter
Technical analysis is often brushed off as arbitrary; if you draw enough lines on a chart, one of them will appear to work. Yet, these random lines work far more often than they reasonably should. Therefore, I usually let the chart form my opinion, not the fundamentals.
Things move slowly on a monthly charting basis, but such a time frame can clarify an otherwise chaotic picture.
We believe the combination of aggressive monetary policy and Covid stimulus allowed the S&P 500 to surpass its expected trading channel in 2021. The market corrected the euphoric pricing in 2022 and much of 2023, only to return to out-of-bounds pricing.
By drawing a line from the pre-financial crisis high through the early 2022 high to the present time, we can identify a statistically probable area of resistance near 5400/5450. Can the market melt through this level? Yes, but it is unlikely to do so, at least without a correction or something much bigger.
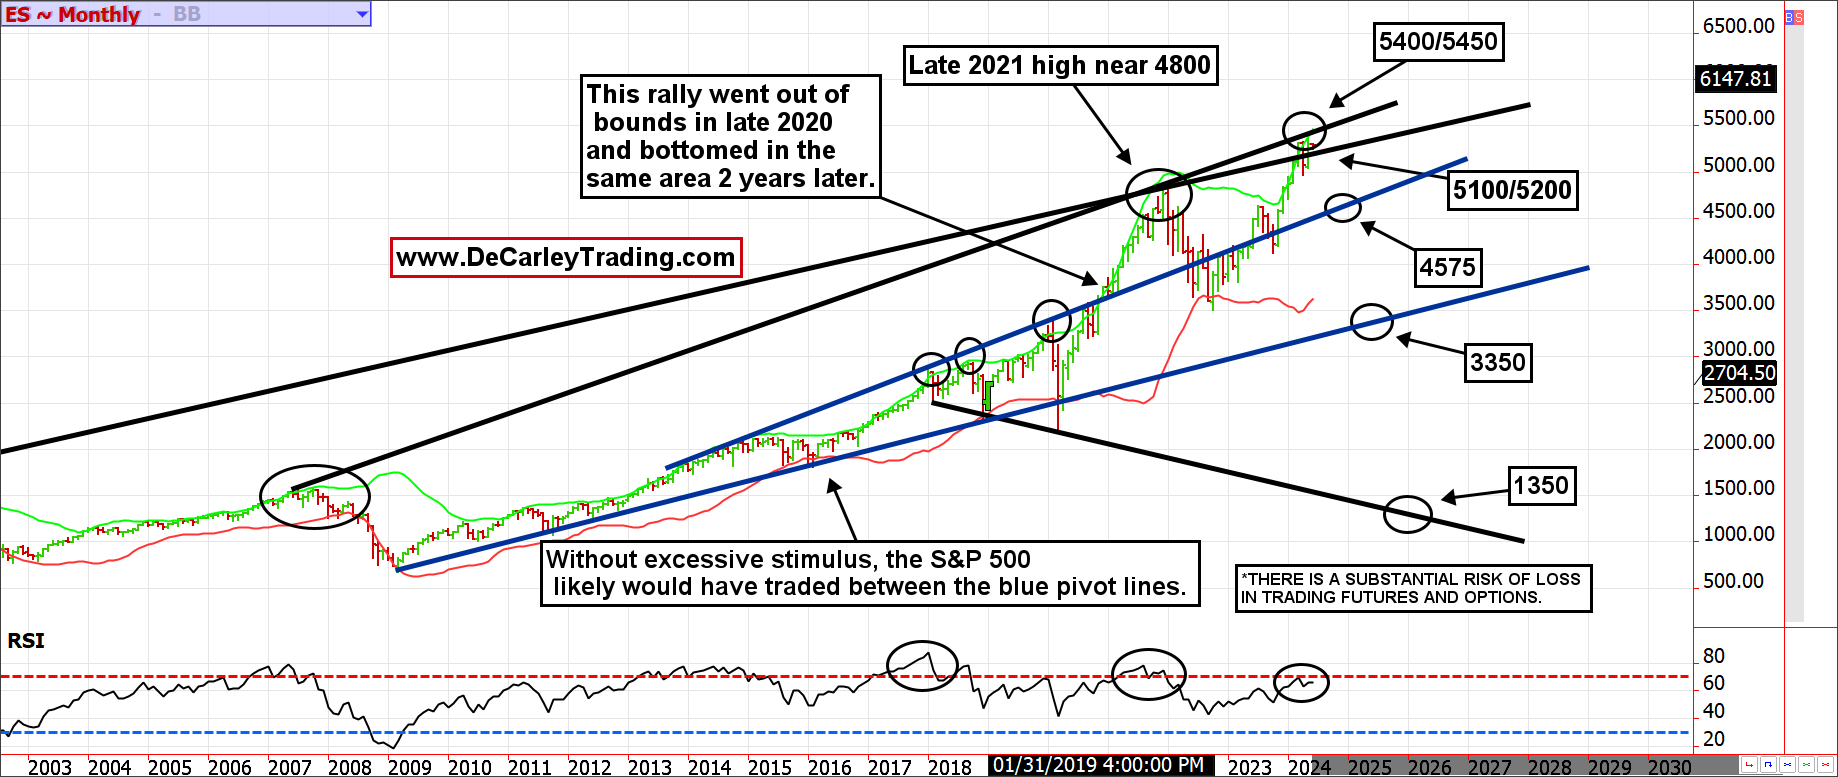
The RSI (Relative Strength Index) depicts an unhealthy rally. It peaked near 87 in early 2018 and has been making lower highs on each subsequent futures rally. Most importantly, the current rally hasn't been able to produce an RSI that competes with the 2022 high.
This should be seen as a red flag; sometimes, such a signal takes weeks or months to play out, but the dye is likely cast.