TheStreet Pro’s Weekly Sentiment Survey, Week 2 Results
Is our team bullish, bearish, neutralish? Well, it’s complex. So, let’s dig in and see.
You've reached your free article limit
You've read 0 of 1 free Pro articles.

What a difference a week makes! While our team still sees the market as very risky, at the end of last week, they were overweight stocks but looking to reduce risk.
The big takeaway from that statement is that this is a new survey and it’ll take people a few weeks to settle into a pattern of how they answer. So, expect a little volatility in the results for now, but I think this is already valuable and will become more so in the future. Plus, maybe we’ll learn something about how quickly our team trades. Perhaps I’ll need to come up with a daily survey!
In any case, please enjoy the results of this week’s survey and let me know how I can improve it. Again, once I’ve got more data, the plan is to track the results.
Part 1: TheStreet Pro’s Sentiment Survey Results
Question 1
Direction: Over the next 2-4 weeks, how do you feel about the S&P 500?
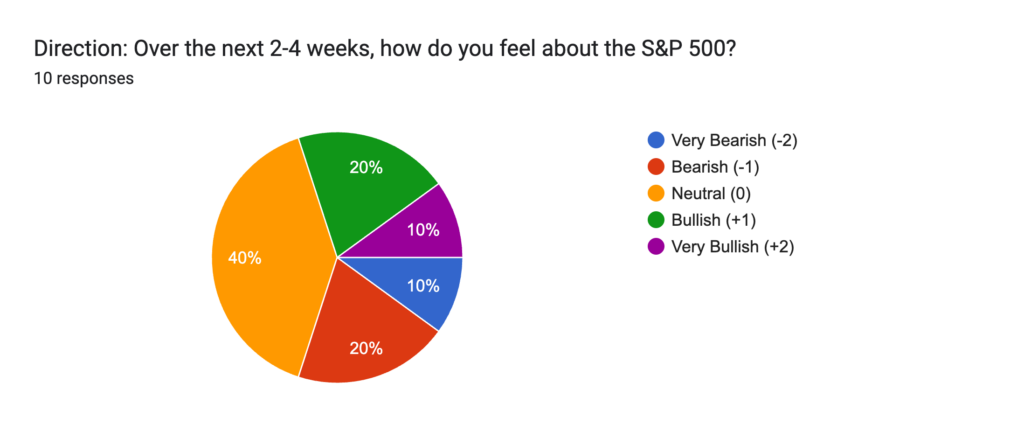
Score: 0
Commentary: The team has shifted from slightly bearish last week, to neutral.
Question 2
Positioning: How are you currently positioned?
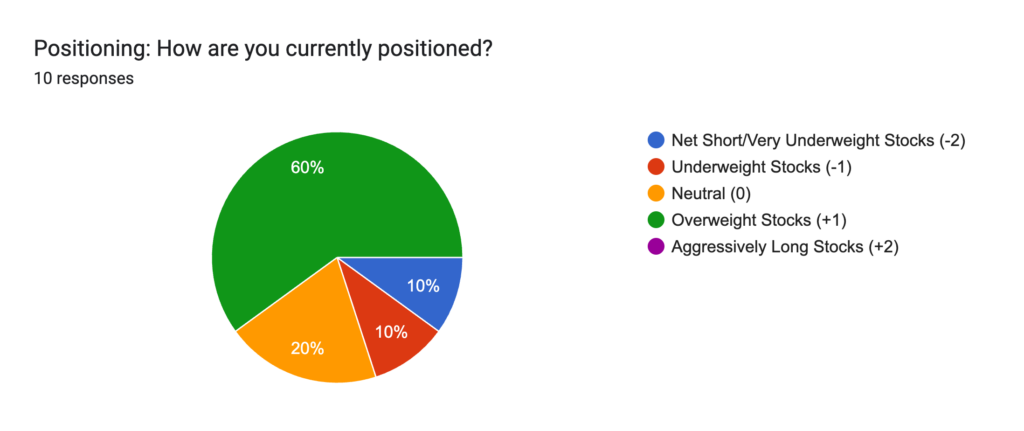
Score: +3
Commentary: The team is generally pretty bullish with 6 people overweight vs. just 2 that are underweight.
Question 3
Risk: How would you rate overall market risk today?
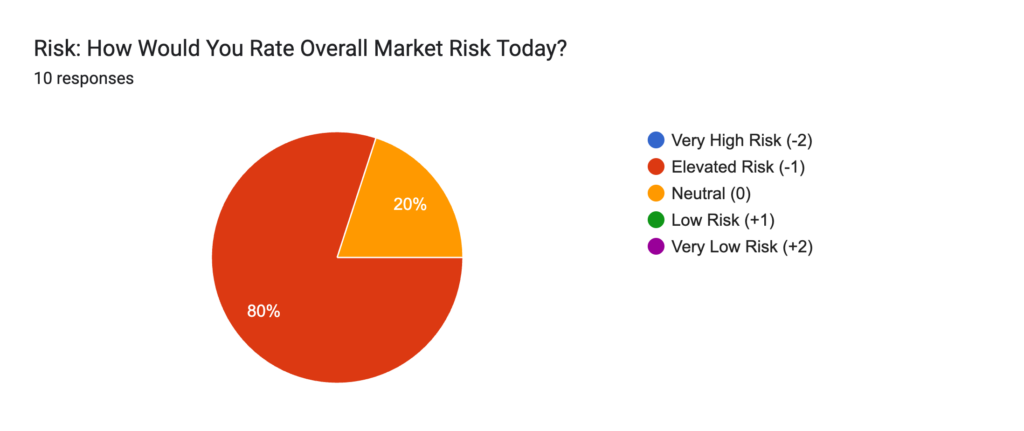
Score: -8
Commentary: Well, the team may be bulls, they see risk. 8 of the 10 respondents think the market is risky.
Question 4
Opportunity: Is it time to increase or decrease risk levels?
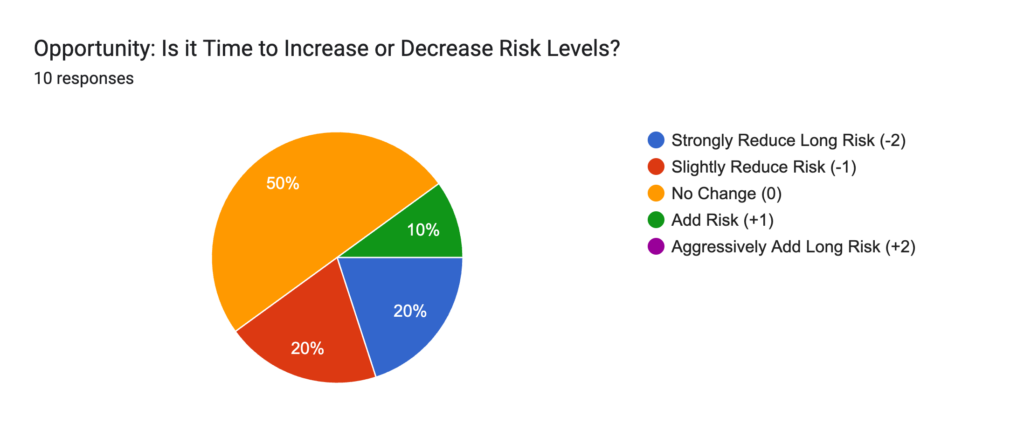
Score: -4
Commentary: Of the 5 who responded to this question, 4 are reducing risk, while 1 is adding risk.
Question 5
Portfolio Activity
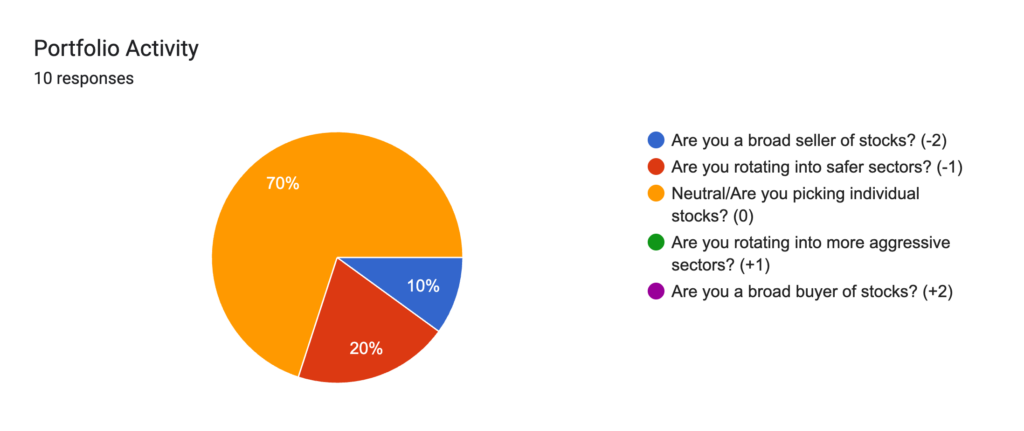
Score: -4
Commentary: Only 3 chose to respond to this one. However, all 3 are reducing risk. 2 are rotating into safer sectors, while 1 is reducing exposure to all stocks.
Part 2: Qualitative Questions
What companies will have the biggest impact this week?
Our team is watching the following companies: Broadcom (AVGO), Lululemon (LULU), Micron (MU), Ciena (CIEN), and… drumroll… SpaceX
What economic data has you most optimistic?
Jobs/Employment, GDP, corporate earnings growth, low consumer sentiment (contrarian), plus an anecdotal rise in animal spirits in investor calls and presentations, which is often a good contrarian signal.
What economic data has you most pessimistic?
Inflation (CPI and PPI), Fed Beige Book, Low savings rate, accelerating job losses (from AI), potential for an increase in geopolitical risk in Iran, and ISM PMI.
What technical indicator has you most optimistic?
The 50 and 200 day moving averages, Small cap price momentum relative to the broader market.
What technical indicator has you most pessimistic?
Money flows, RSI for the S&P 500 and Nasdaq, momentum in interest rates
