These Lines Have Held So Long It's Almost Like They're Magic
As Nvidia's influence continues, I am not sure I have ever seen a market that refuses to break a line like the one on the S&P.
You've reached your free article limit
You've read 0 of 1 free Pro articles.
A few days ago Nvidia NVDA was down so other stocks got some life. Now Nvidia goes up and it sucks the life out of everything else. It’s Nvidia's world and we’re just living in it.
Sure, breadth was flat as a pancake during the near 40-point rise on Thursday but it’s not dissimilar to last Friday when the S&P 500 rallied 57 points with net breadth at +500. Okay, maybe Thursday was worse. But it’s all the same situation.
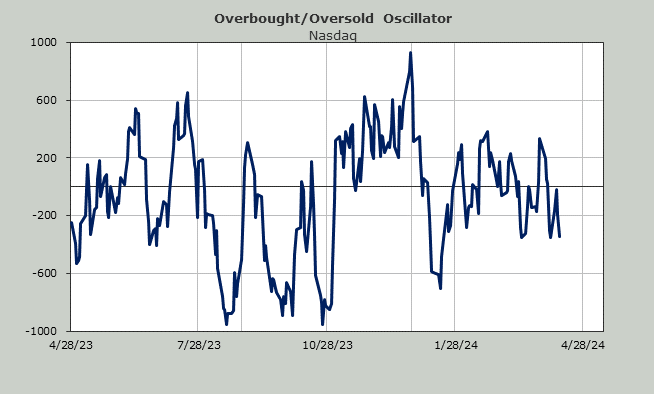
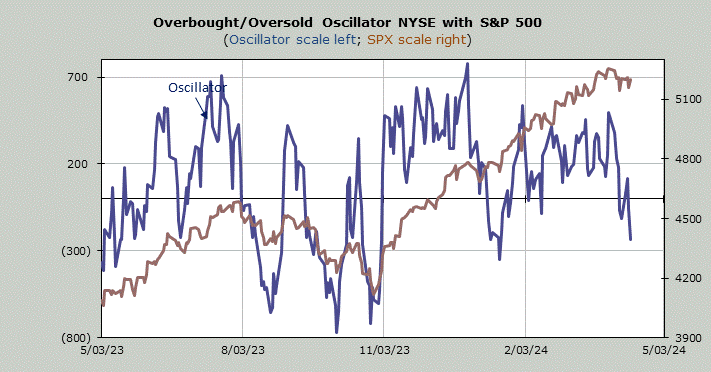
I felt the need to give this preamble because when you look at the chart of the Overbought/Oversold Oscillator you are going to wonder, how is that possible? It’s possible because there has been no upside momentum in this market almost the whole year.
You’re wondering how can I possibly say that when the market has been nothing but up all year. This Oscillator is about breadth and if you look at how it moved right up until we entered this year you can see how different the swings were than they have been this year. Heck we couldn’t even get up into that +700 area. We had no trouble doing it three times last year.
And now look, it has plunged, something it normally does when the market indexes —in this case the S&P — plunges as well. I can conjure up a million reasons for why but does it matter? What matters is that the momentum in the majority of stocks has been to the downside for a few weeks now.
Are we oversold? A little bit and only short term, or at least we’ll be that way early next week.
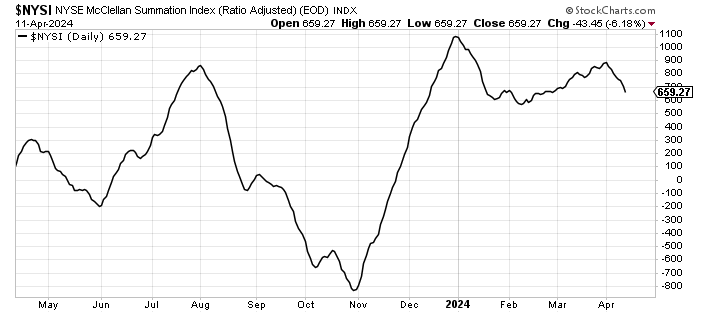
Something else that changed as we entered April is the McClellan Summation Index turned south, similar to the way it did in early January.
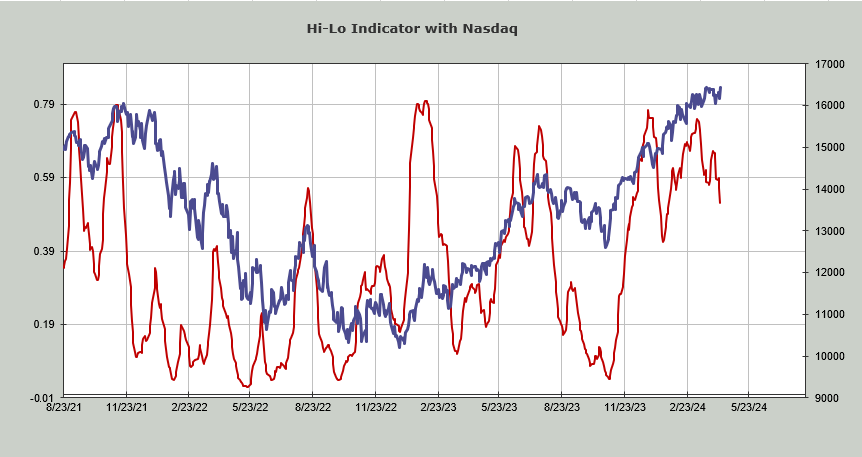
Then there is the Nasdaq Hi-Lo Indicator, which has plunged to 53%. You can see it, too, looks more like the Oscillator with that big plunge in January, the recovery to a lower high and now the resumption of the downtrend. If the market doesn’t fall apart before midweek next week this will be slightly oversold again.
Then there is the DJIA, which broke its uptrend line a week ago and has now been red for four straight days and eight of the last nine trading days. The Oscillator reflects the DJIA more than anything these days. And the Russell 2000.
But the S&P’s line held, as did the Nasdaq’s. I will continue to use that 5150 support line level for the S&P. I suspect by late next week that will be lifted (if it doesn’t break before then).
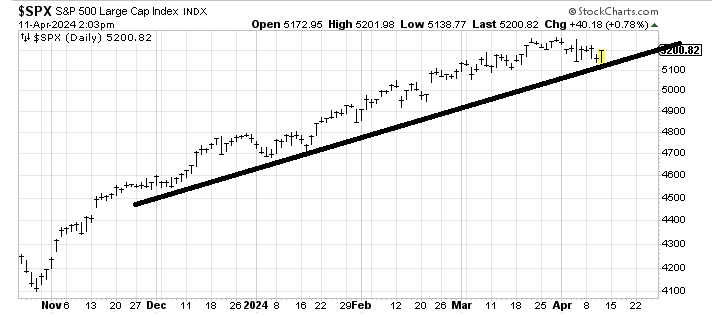
I am not sure I have ever seen a market that refuses to break a line like this but as I have said so many times of late, it’s simplistic but it’s what the market cares about now so unless/until it breaks, that’s the market we have.
In Top Stocks I discuss specifically how We're Living in Nvidia's World and dig into a bunch of charts, including Arm Holdings ARM, Boeing BA, Gilead GILD and Wingstop WING.
