We're Living in Nvidia's World
It was the same story Thursday with the market's relationship with the beloved chip stock. Let's examine the chart, the magic lines of the S&P and Nasdaq, my OB/OS Oscillator and more.
You've reached your free article limit
You've read 0 of 1 free Pro articles.
The Market
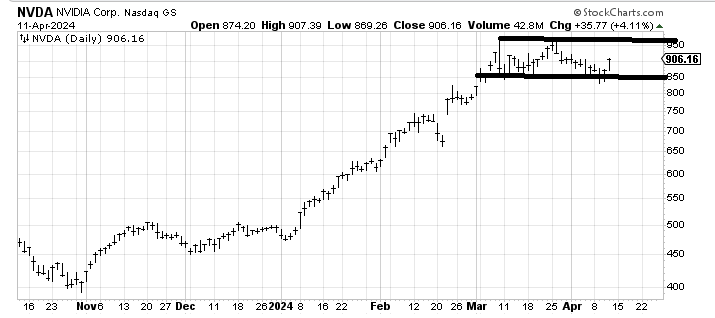
It’s Nvidia's NVDA world and we’re just living in it.
I know I should complain about breadth since it was flat on a day the S&P 500 was up 38 points. But how is that worse than last Friday’s 57-point gain with breadth that would have been good if we were up 20 handles?
It’s the same story: Nvidia rallies and it sucks the life out of the rest of the market. It sells off and there is life elsewhere.
I said it was oversold the other day but I remain unconvinced that it is off to the races from here. It looks like a trading range to me for now.
A few other points of interest. The lines on the Nasdaq and the S&P and the SOX continue to hold, almost as if they are magic lines. The lower line for the S&P is still 5150-ish. Next week it will be higher. But for the Nasdaq 16,000 remains the level. Unless/until they break, this is the market we have.
The S&P hasn’t had two consecutive up or down days since April 2. Oh sure, at some point that will change, but I’m more interested in the fact that once again the S&P closed right at/near 5200. Since April 2, with the exception of last Thursday’s big whoosh down and Wednesday's big move lower, we have been hovering at 5200. That means a break down under the line would not just break the line but break the pattern of closing right at 5200-ish.
Then there is the DJIA, which did break its line a week ago and remains in a decline. It is down about 1,000 points since last week and has now been red for four straight days and eight of the last nine days. It is getting oversold just based on that.
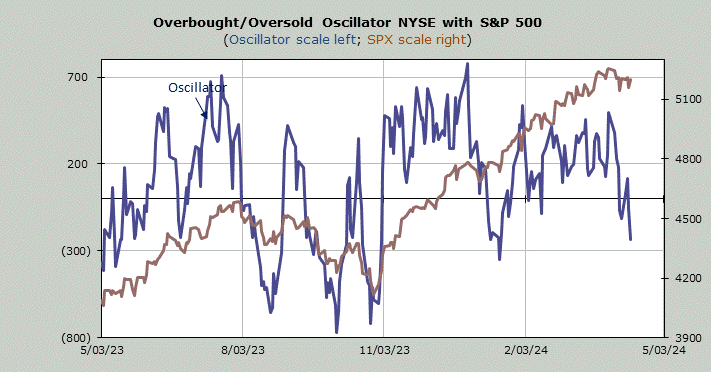
Finally, there is my own Overbought/Oversold Oscillator. In the year 2024 it has not made a higher high. It has not even gotten close to a higher high but it has plunged back toward where it was in mid-to-late January. I think if you look at the chart, below, you can see how unusual it is for this to plunge and the S&P to sit there or continue to climb. I do believe it has something to do with the fact that 10 stocks are 30% of the index so we are beholden to the index movers.
New Ideas
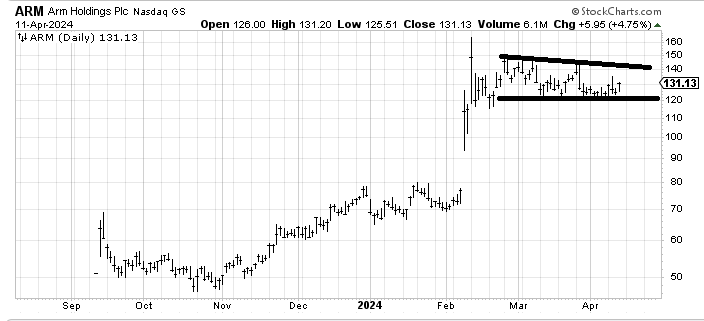
Last fall I recommended Arm Holdings ARM. It had a head-and-shoulders bottom and I even joked that now it had all the body parts. It had a great run but it has gone nowhere since February. The stock had the chance to break $120 and it hasn’t, so as long as it stays over that $120 area I like the stock.
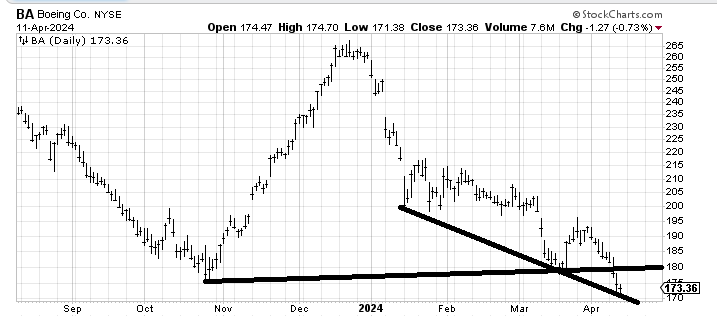
If you are looking for a DJIA stock that is oversold, look no further than Boeing BA. It has barely had an up day in April. I’d trade it to the upside.
Today’s Indicator
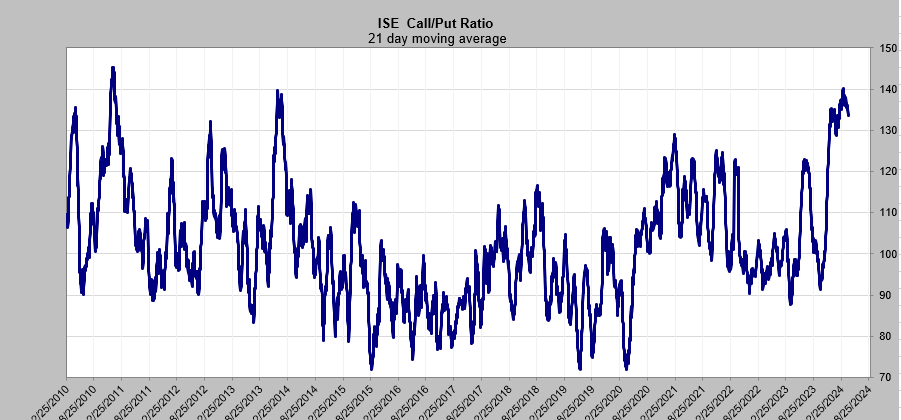
The ISE call/put ratio’s 21-day moving average is heading down. Those two other peaks you see on the chart, below, were way back in late 2010 and early 2014. Curiously, both 2011 and 2014 were quite rocky years for the market.
Q&A/Reader’s Feedback
Helene welcomes your questions about Top Stocks and her charting strategy and techniques. Please send an email directly to Helene with your questions. However, please remember that TheStreet.com Top Stocks is not intended to provide personalized investment advice. Email Helene here.
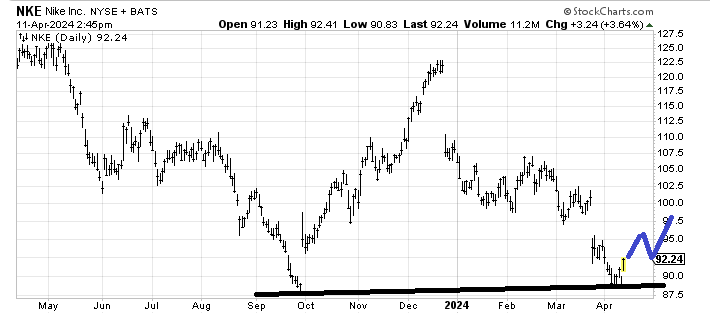
You might recall back in February I thought Nike NKE had come down enough and should rally. The stock rallied for a few days and then promptly fell 15%. So the question is if it can finally get going now. Well it filled that gap from September so it ought to rally now. I would love to see it map out as I have drawn in blue below.
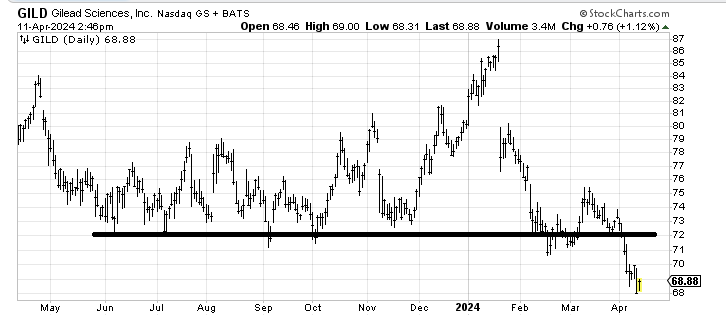
Gilead Sciences GILD had a bad break down in early April. While it ought to rally I think resistance in that $72 area is going to be a wall the first time back up there now.
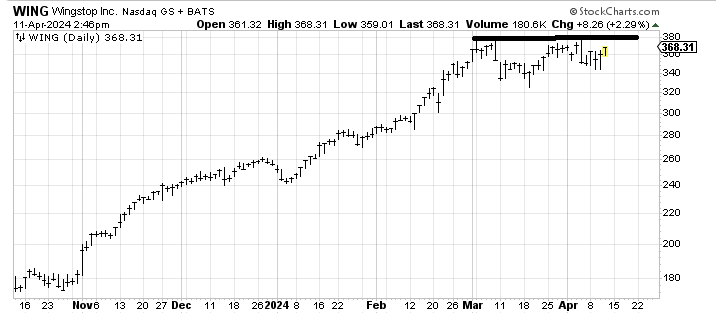
Wingstop WING is not my kind of chart because it is not down and out but, if it gets through $380 it would measure to the $420 area.
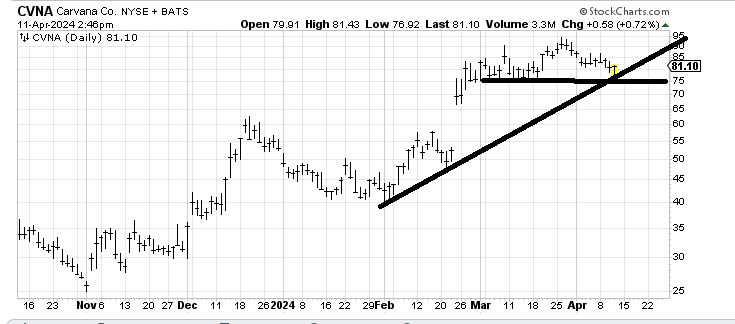
I don’t like the chart of Carvana CVNA, but it is bouncing off that line. A break of $75 and it should try and fill that gap below.