There's No Panic as Market Holds Those Lines
Yes, the lines are still with us. But why were folks panicking in March but not today? Let's look at the S&P, SOX, Nasdaq, Russell, QQQs, silver, and a lot more.
You've reached your free article limit
You've read 0 of 1 free Pro articles.
The Market
We finally got a down day and as soon as we were down for an hour or so the selling dried right up. Heck, even the bonds only got themselves right to the line. They tried to get over the line and then they just seemed to lose the struggle.
But I know all you are interested in is the lines. Have any of them broken? Not that I can see. Several are sitting right at them but for the time being they have held. Let’s take a look.
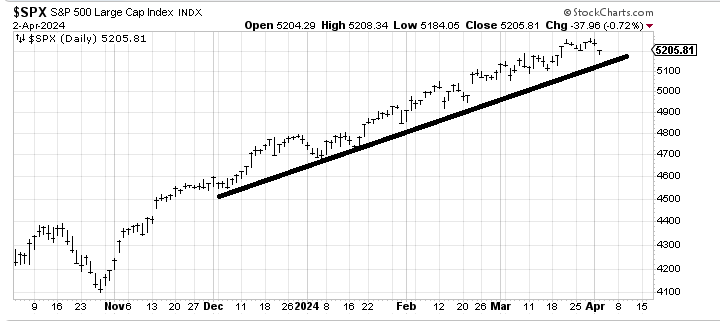
The S&P 500 didn’t even get to its line. Keep in mind, as time goes on the level of the line rises. We entered the week with the line at 5100 and now it’s approximately 5120-ish (and rising).
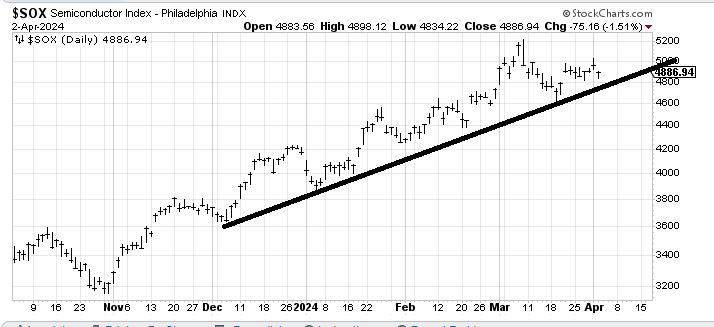
The SOX bounced right off that 4800 area once again. And this week that line is right there (last week it was lower).
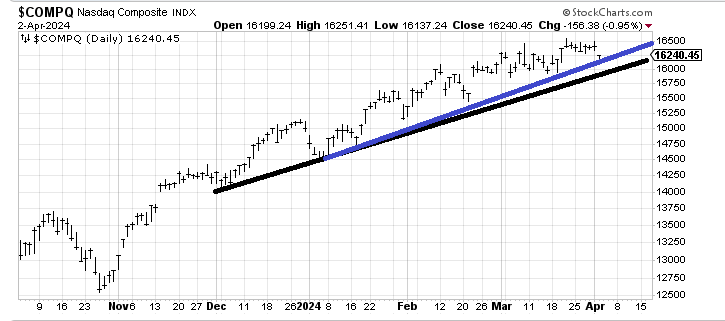
If I start the Nasdaq’s line in December it comes in at 16,000, which, as you can see, is the level the Nasdaq held since it gapped up there in mid-February (black line). If I begin the line in January (blue) then we bounced right off it today. I still think 16,000 is the support level we should care about.
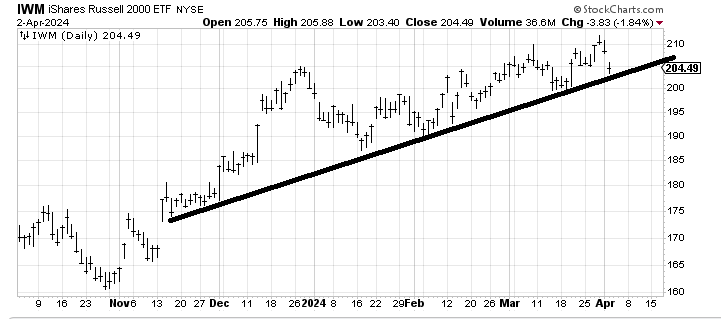
The Russell 2000 (using IWM) has come right to the line as well.
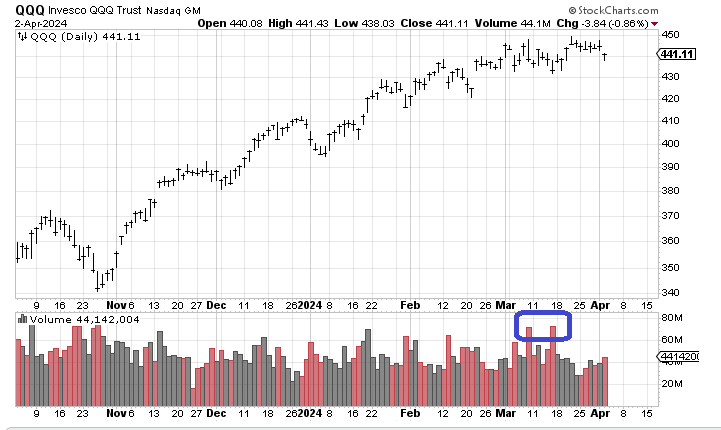
So as you can see, the lines are still with us. There was no real panic selling today. We can tell because volume didn’t climb. The volume for the QQQs was 44 million shares. Just look at two decent down days we had in March (blue circle) and we can see the panic in the volume. Today there was none of that. I consider high-volume declines to be bullish. Low-volume ones tend to mean there was no panic. Why were folks panicking in March but not today? Is that a sign of complacency?
My short-term oscillator is not yet oversold. My best calculation is that arrives around Monday. If we can get a proper correction in the coming days it would take that oscillator down to oversold. If we can’t, then it’s more of the same.
New Ideas
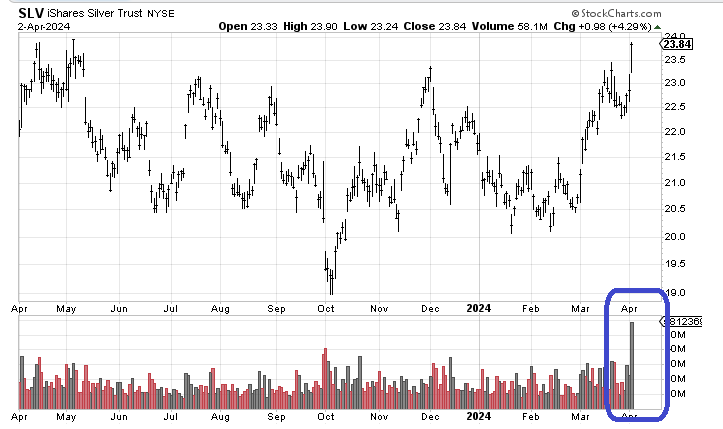
The most shocking statistic for me today is that the DSI for gold did not go over 90. I am shocked. It remains at 88. But silver’s climbed to 88 to join gold. I recommended the iShares Silver Trust SLV on Sunday and it has done well but what I’d like to show you is the volume today. That was panic-get-me-in-type volume! And just as it nears the old highs. I still like silver but if its DSI goes over 90 tomorrow and volume continues to explode I will have to look for some give back in the days ahead. I’d rather the DSI stay below 90 and we get some give back to lower the DSI.
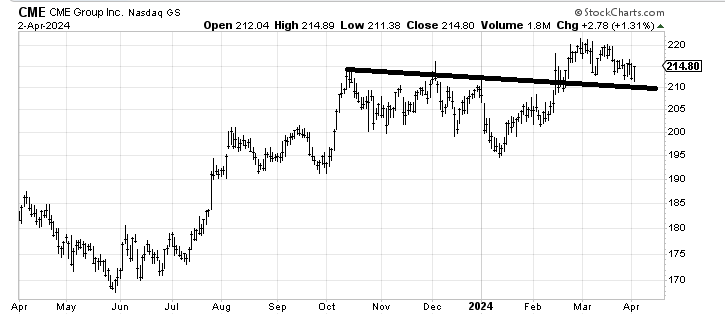
As a reminder, I also think CME Group CME is trying to complete this correction. If commodities are going to be hot, CME ought to ultimately benefit.
Today’s Indicator
The McClellan Summation Index is now heading down. But it has alternated back and forth in its lethargic fashion.
Q&A/Reader’s Feedback
Helene welcomes your questions about Top Stocks and her charting strategy and techniques. Please send an email directly to Helene with your questions. However, please remember that TheStreet.com Top Stocks is not intended to provide personalized investment advice. Email Helene here.
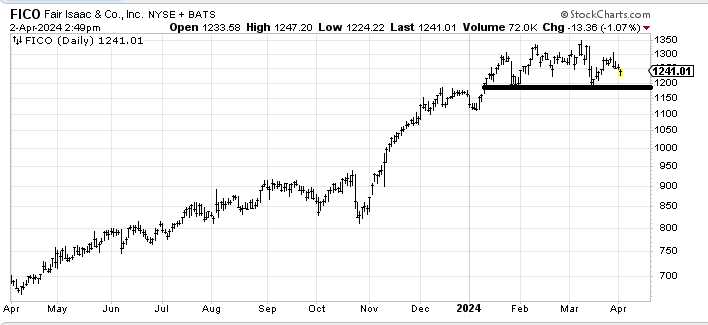
Fair Isaac FICO looks like a head-and-shoulders top, doesn’t it? But how many charts have we seen like this that don’t break? See McDonald’s MCD. Or even Paychex PAYX, which we looked at last week. It looked terrible and at the time I said but I still expect it will bounce off $116. Today, it had terrible earnings and still it bounced and didn’t collapse. So, unless FICO cracks under $1,200 it’s probably in a trading range of $1,200-$1,350.
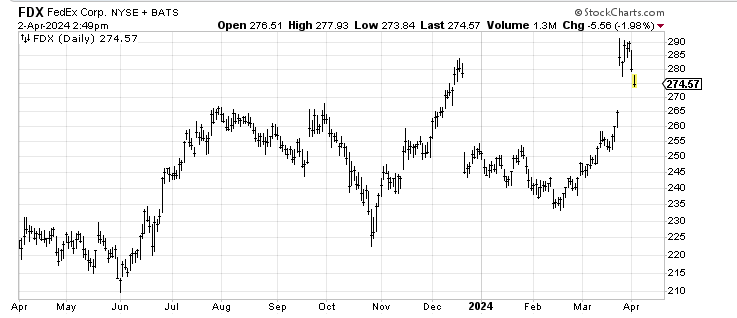
FedEx FDX should have held up over that old high and it didn’t. Now it seems to want to fill the gap around $265. If it gets to $265 and fills the gap I’d guess it bounces from there.
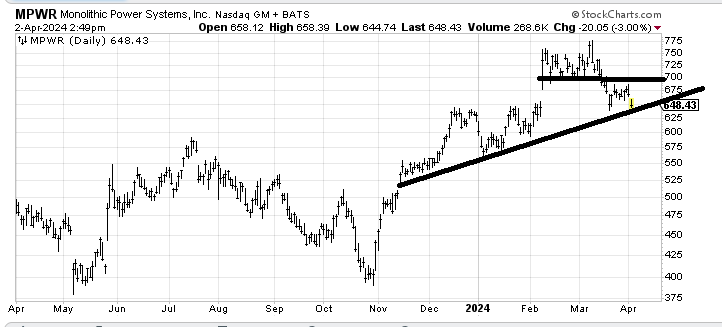
Monolithic Power Systems MPWR should bounce off this line but it seems fragile to me. There is a measured target around $625 so I think I would wait to see if this line holds.
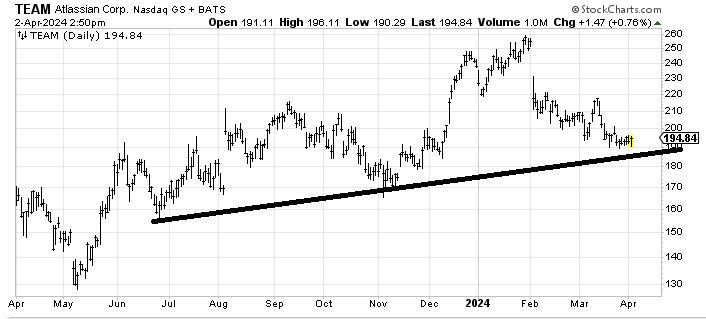
Atlassian TEAM is starting to look a little sold out down here. But as long as it stays over $185 the stock is worth watching for signs of holding and curling under.
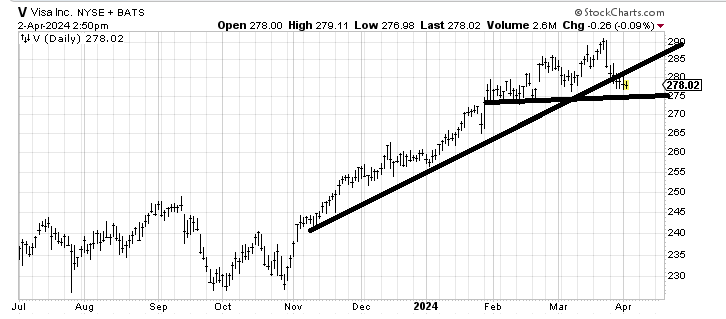
Visa V has stabilized from the selling in late March but thus far shows no signs of any buying interest. If it is going to be okay I think it needs to bounce and come back down to this $275-280 area for a test or it needs more time. Right here it feels in the middle of nowhere.