The Slop Factor: Oil Surges, Semis Stabilize, and Market Internals Remain Mixed
Oil was left for dead just weeks ago. Now energy stocks are everyone’s favorite trade again. But while sentiment has reversed sharply, market internals continue to flash conflicting signals that could keep investors guessing.
You've reached your free article limit
You've read 0 of 1 free Pro articles.
Just prior to my time off, there were calls for oil to go much lower. There was a podcast by a prominent oil guy where he gave a mea culpa for saying crude would go to $200 when, in fact, it did not. And of course, while I was gone, the Economist, who you may recall in late April, had oil at $200 on its cover, decided on July 2nd they too were wrong and put oil on their cover once again, this time saying it was going lower.
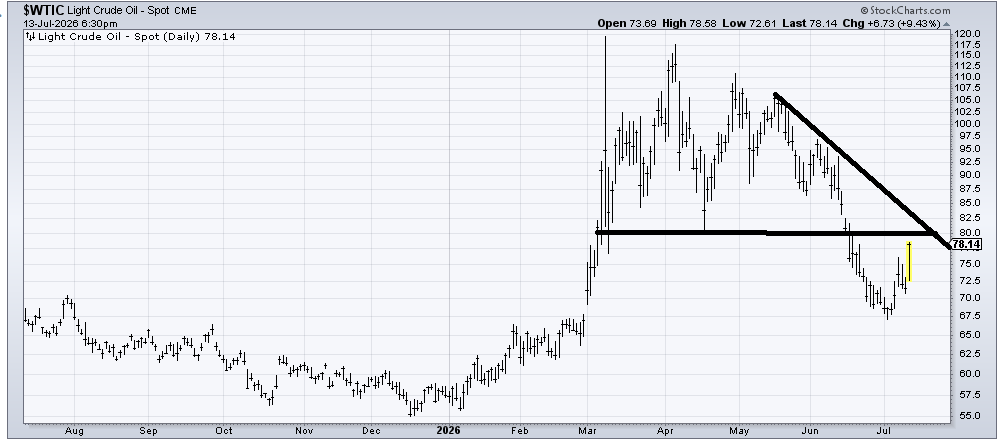
Just before I departed, we did see the Daily Sentiment Index (DSI) for oil get to 12. I said I thought it should rally, but even I was too timid by saying it was just a trade. Here we are ten bucks higher, and the folks on Fast Money had three out of the four Final Trades as long energy stocks!
I do think WTI runs into some short-term resistance in that 80 area, but much more so at 85-87.
Then there are the semis, which I noted last week are still where they were in late May, despite the hoopla. Now we have the Korean stock market collapsing, and our SOX, as bad as it looks, still refusing to break the early June low, let alone the May low.
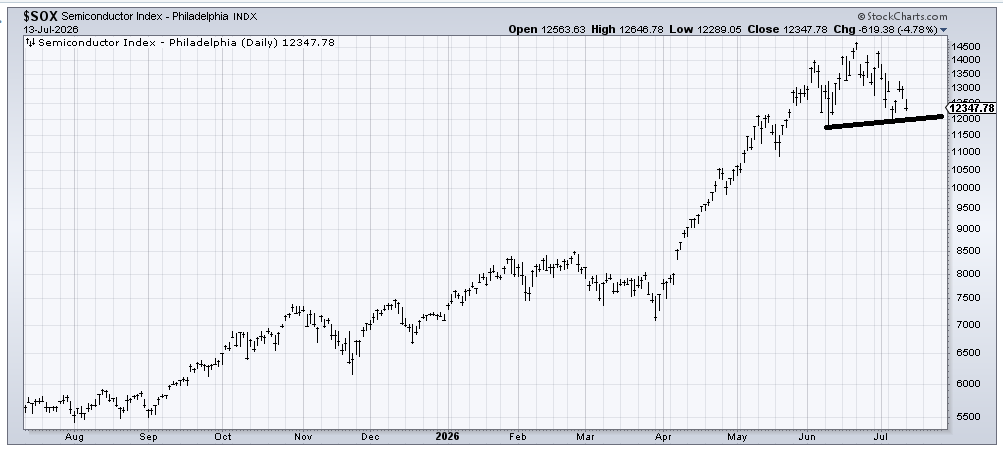
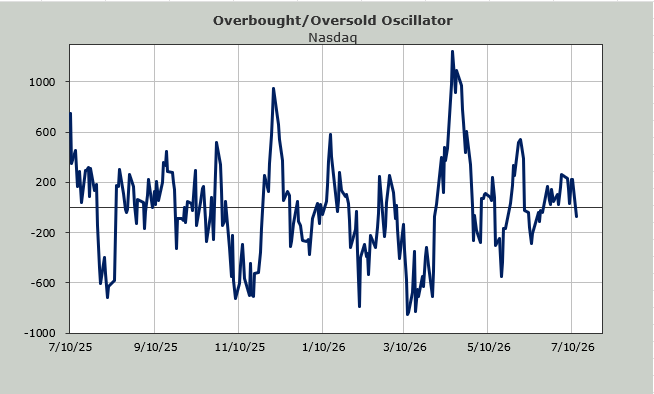
I do not like that in the last week, including Monday, the number of stocks making new lows on Nasdaq increased to 220+. That is often a warning sign for me. But let’s go back to the indicators being so sloppy.
Nasdaq’s McClellan Summation Index is heading down (tells us the direction the majority of stocks are heading). It will take a net differential of nearly +7 billion shares to halt the decline. As a reminder, with Nasdaq I use volume, not the advance/decline line. So +7 billion shares mean up minus down volume would have to be +7 billion shares to halt the decline in the Summation Index, and more to reverse it to up.
Considering Nasdaq traded a total of 7.3 billion shares on Monday, you can see that even a great day in the market wouldn’t get the indicator to stop going down. Now take a look at what I have just described in chart form. When this indicator needs that much to turn it around (I often use +8 -10 billion shares as an extreme), it’s getting oversold.
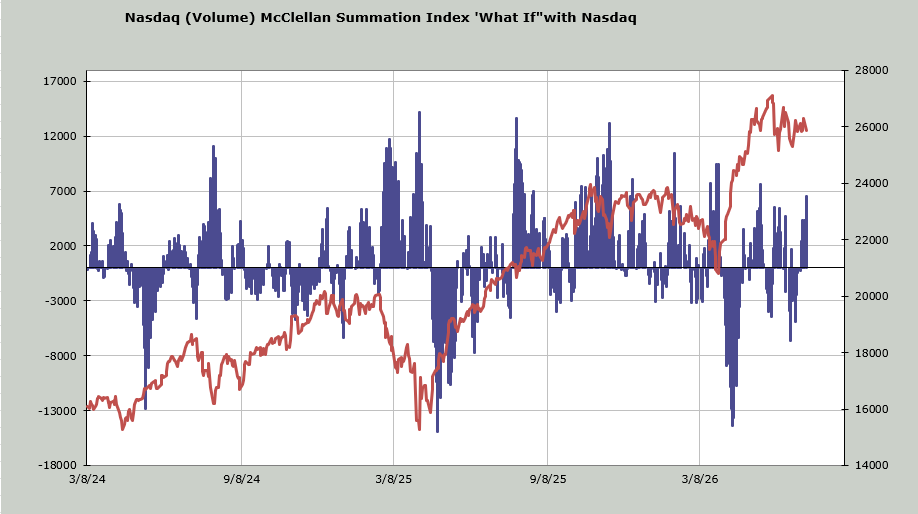
What this all means is that if we do see Nasdaq with some more downside in the next several days, we would get it to an oversold condition.
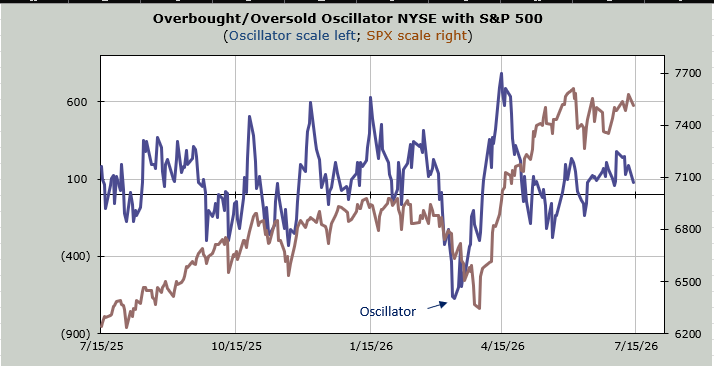
It is unusual to have one indicator overbought while the other is oversold. Or one indicator showing fear in the market (the put/call ratio discussed here yesterday), while another indicator says everyone is ‘all in’ (the Investors Intelligence bulls are at 54%). But that’s the sloppy indicators I keep noting.
I would cheer for more downside since some of the indicators are closer to oversold than overbought, but the way this market has been going, we’ll probably rally on Tuesday just to keep them sloppy.