The Long(ish) and Short of This Market
Let's look at the intermediate-term status of the market, and the short-term overbought condition. Also, we inspect the 'Magnificent 7' and the charts of Google, some semiconductors, and ... yummy ... Hershey.
You've reached your free article limit
You've read 0 of 1 free Pro articles.
The Market
I'm going to separate this weekend’s missive into two parts: The first part is the intermediate-term update and the second part is about the short-term overbought condition.
The intermediate term is not yet overbought.
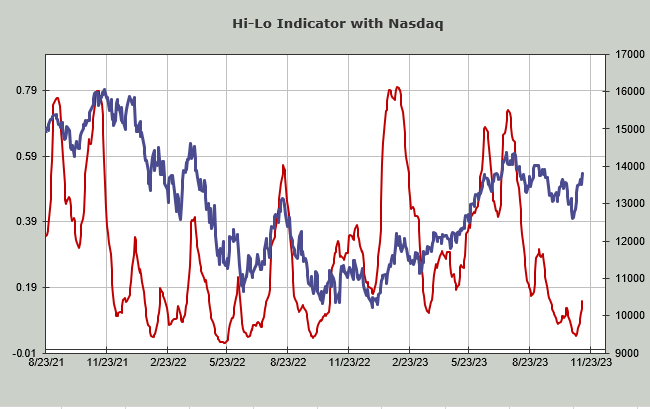
The Hi-Lo Indicator for the New York Stock Exchange is at .31. Nasdaq’s is at .15. Nasdaq’s is still oversold. The NYSE is neutral. The chart is shown below.
The Volume Indicator is at 48%. Overbought is the mid- to upper-50s. I’d say this is no longer oversold, but it is not close to overbought. The chart will appear here on Wednesday evening.
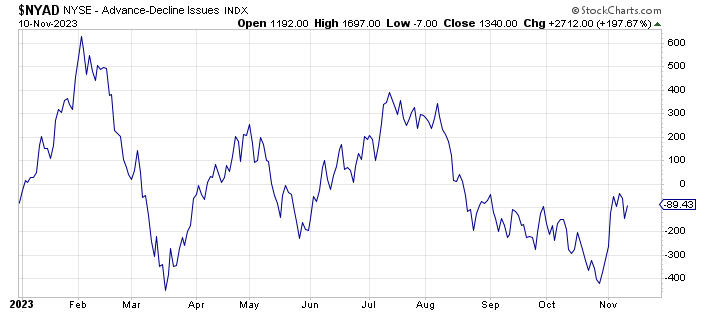
The 30-day moving average of the advance/decline line is not overbought, either. It will be a little bit overbought by the middle of this week. This is the only intermediate-term indicator I have that is close to overbought and at that I believe it would dip and rise again to a fully overbought condition.
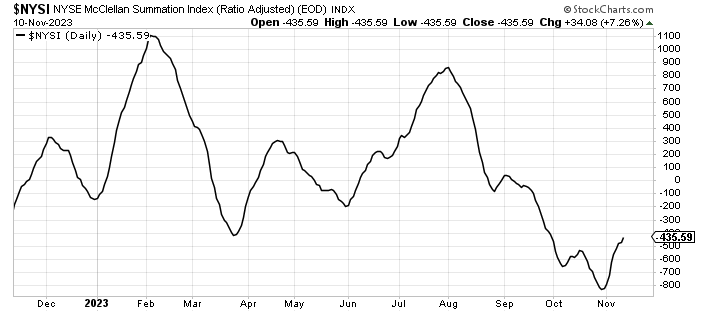
The McClellan Summation Index is still rising. Not only that, it made a minor higher-high last week. It came close to turning back down but Friday’s rally saved it.
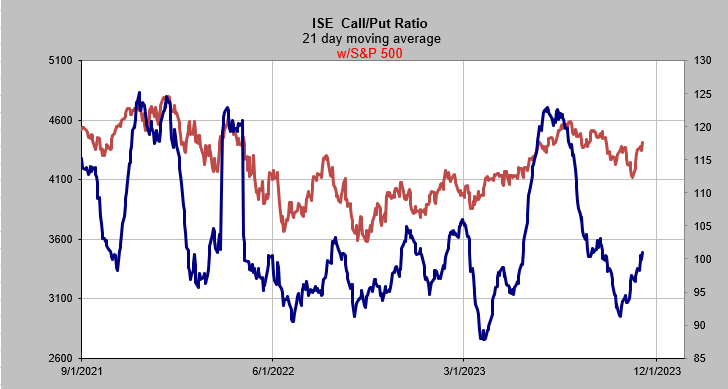
Sentiment is not yet giddy. It is clearly no longer bearish, and I’m not even sure it is complacent quite yet. I just think it saw a turn too quickly and a pullback would keep it from getting too giddy. We’ll see what this week brings, but thus far the put/call ratios have not come down at all. It’s the quick drop in bears in the American Association of Individual Investors poll that makes me think pullback.
The International Securities Exchange's 21-daily moving average is still rising. It is no longer showing too much fear, but it too does not show giddiness, although it has risen quite a bit from the depths of despair a few weeks ago.
Now for the shorter-term.
We are short-term overbought on the big-cap indexes. The number of stocks making new lows has continued to expand, while the new highs has failed to do so. For example, the Nasdaq new lows are now 353. The peak reading was just over 600 and Nasdaq was 1,000 points lower. That’s when I ask myself: If Nasdaq falls 1,000 points from here, will there be more than 600 new lows? I would say, Yes. What would help this statistic is small caps joining the party.
I would add one caveat here, and that is we’re in that time of the year when we see tax-loss selling between now and year-end, so new lows don’t tend to contract as much as they would in say, January.
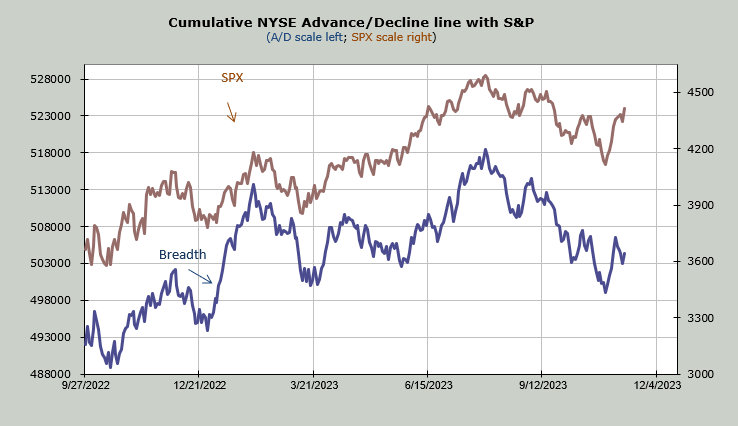
The breadth of the market has been terrible. On this chart you can see the breadth vs. the S&P 500. Divergences like this, should they persist, would be put on the bearish side of the ledger once the intermediate term indicators get overbought.
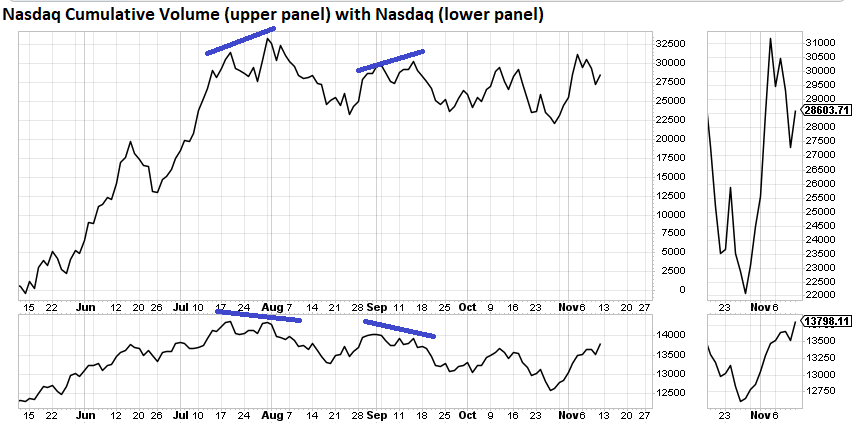
Even on Nasdaq it’s gotten pretty narrow. Here is a chart of cumulative volume for Nasdaq. It generally tracks Nasdaq and, in fact, Nasdaq itself tends to underperform it. In the top panel, you can see this breadth chart making higher-highs last summer while Nasdaq doesn’t. Even in September Nasdaq (lower panel) made a lower low but Cumulative Volume did not.
Now look at the last week. Nasdaq has romped to a higher-high (vs. early November) and this breadth indicator has not. This is a chart I will focus on. Many will rationalize it by saying it’s the "Magnificent 7" effect. I would say the Mag 7 has been with us longer than the last few weeks so this is a change.
I saw even The Economist had an article this weekend on the Mag 7 and the "other 493". It almost feels like it’s become so obvious that maybe the others deserve some attention. Should we get the pullback, I expect this coming week and we see the new lows contract while the indexes back off I would take that as a positive sign.
New Ideas
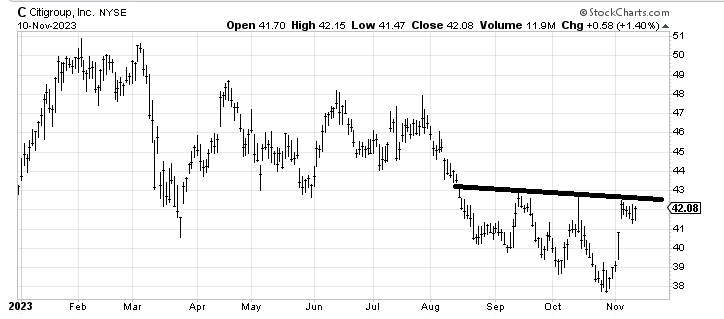
Last week we revisited the chart of Bank of America and I was lukewarm on it now that it had rallied, already. But I look at the chart of Citigroup C, which has always been a laggard, and I see a stock that didn’t pullback much and one that is close to a mini breakout. I’d love it if it would fill that gap at $41 but over $43 and folks might take notice.
Today’s Indicator
The Hi-Lo Indicator is discussed in full above.
Q&A/Reader’s Feedback
Helene welcomes your questions about Top Stocks and her charting strategy and techniques. Please send an email directly to Helene with your questions. However, please remember that TheStreet.com Top Stocks is not intended to provide personalized investment advice. Email Helene here.
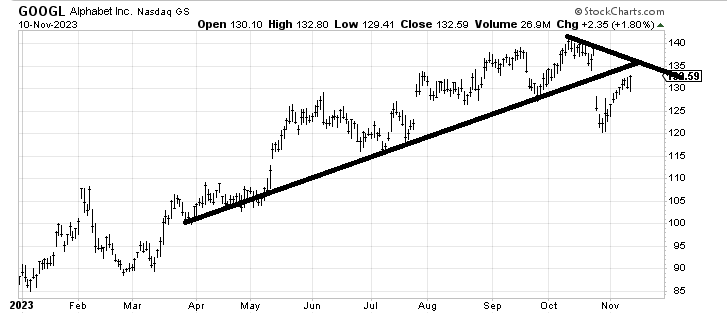
Google $135: We looked at Alphabet GOOGL a couple of months ago and I had thought at the time that a trip down to fill that July gap was possible and that the stock was a buy if it did that. It more than filled the gap and is now working on filling the gap down from the earnings a few weeks ago. On a trading basis, I would say that around $135 is where I’d take some profits, because there is also a downtrend line there .
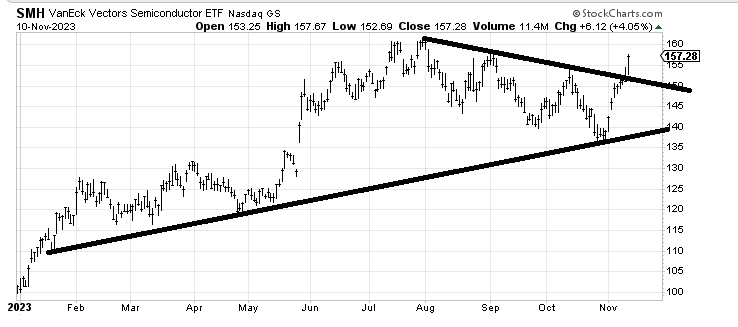
Where The Chips Fall (and Rise): The semiconductor exchange-traded fund SMH crossed a downtrend line that seems to have gotten folks excited. But it still has resistance overhead, all the way up to $160. Since I am terrible at chasing, I would say if it came back and tested that downtrend line I’d be a buyer at around $150.
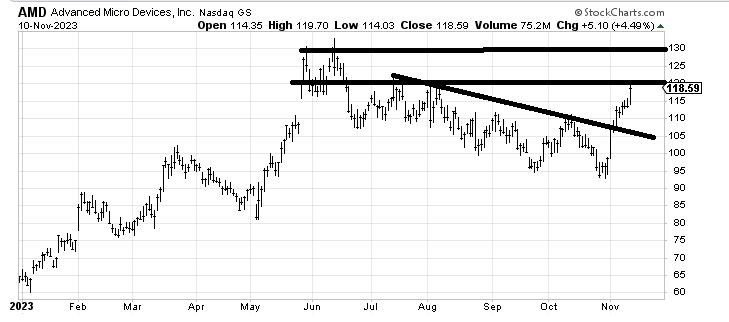
But, Advanced Micro Devices AMD is a stock I liked a few weeks ago, when asked about it, so I think it is more instructive. It has rallied right into the lower end of resistance. Some sideways action or a pullback would help the chart but either way I think $120-$130 is going to be hard to chew through without a pullback or digestion.
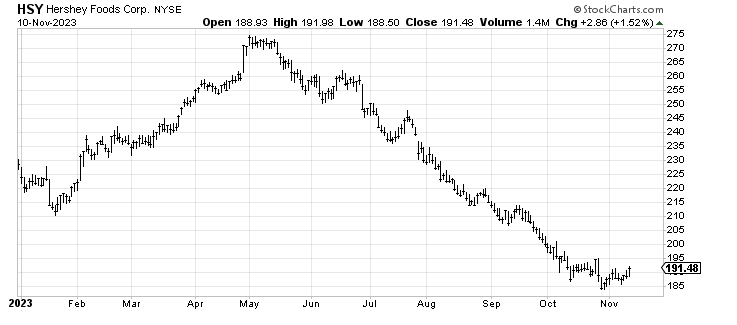
Melted Hershey: Since I have been bullish on some of the staples stocks lately, I was asked about Hershey HSY. Gosh, that has had quite a decline. It is quite early if this is to be a bottom of any kind, but I am inclined to think if the stock can get over $195, it would be the first minor higher-high since May and that would start the process.