The Great GDP Trick
Call it a rug-pull if you will, but let's see what just happened with that magical revision and dashed hopes for a half-point rate cut.
You've reached your free article limit
You've read 0 of 1 free Pro articles.
Thursday morning. Nvidia's NVDA quarterly earnings had come and gone. The stock was trading lower, but U.S. equities quite broadly, were trading higher. Positive news had broken overnight in Asia concerning Apple's AAPL expectations for iPhone sales this coming season. Birds were chirping. Waves were softly rolling at the shore. Children could be heard playing in the distance.
Then it happened.
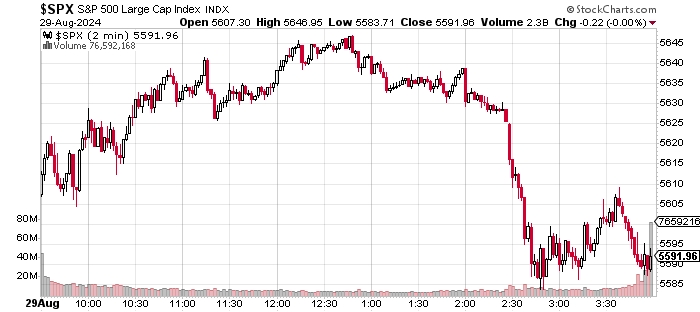
After lulling markets into a false sense of security, the rug was pulled. It started at around 2 p.m. Eastern time, but the avalanche truly took another half hour or so to manifest itself.
It wasn't just equities. U.S. Treasury debt securities sold off as well with the longer end of the slope of the yield curve selling off more quickly than the short end. In fact, the long end of that curve has been selling off all week. That made for a rather strange Thursday ahead of a three-day weekend. The post-NVDA earnings selloff was not really a surprise, though it's timing certainly was. That said, the way Thursday afternoon went, the overnight support for U.S. financial markets we now see, also surprises somewhat.
You have to see what this looks like on a chart. What you see below is a two-minute chart of the S&P 500 for Thursday:
Now, I'll show you a year-to-date chart of the spread between the yields of the U.S. Two Year Note (currently paying 3.91%) and the U.S. Ten Year Note (currently paying 3.86%):
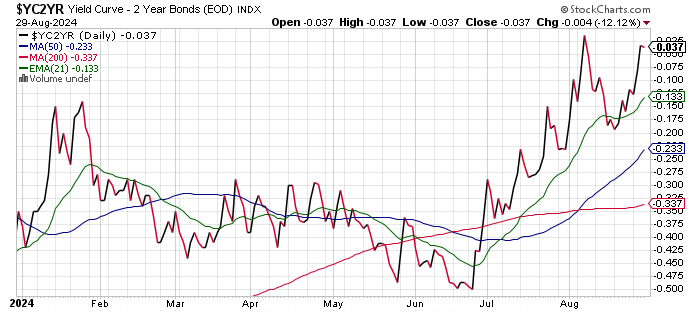
Readers will see in this chart that for the second time this August, this particular spread is close to actually "un-inverting." Is that a positive? That's hard to say. This spread is considered a predictor of economic contraction, and it has been inverted for a long time. Reversing course does not erase that this spread had sent that inversion signal. Additionally, the spread between the yields for the U.S. Three Month T-Bill and U.S. Ten Year Note is considered a far more accurate predictor of economic contraction than is the above spread and that spread remains deeply inverted. Take a look at this:
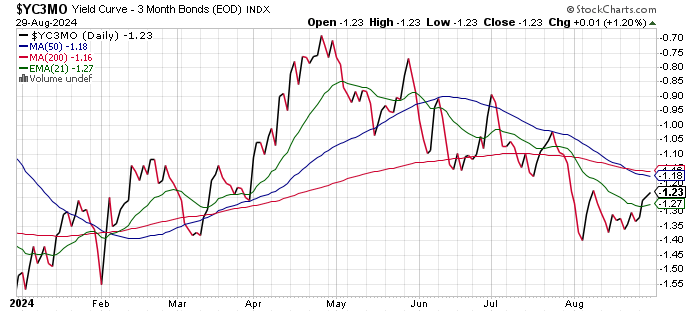
This spread is far more inverted now than it was back in the spring. Odd? Not really. I mean, periodic economic statistics have been sending mixed messages due to a skittish economy and badly inaccurate government data for at least a year and a half.
That brings us to a simple question. Why Thursday afternoon? It comes to a broad understanding that took a while to percolate: Thursday morning's Bureau of Economic Analysis revision to second-quarter U.S. gross domestic product growth basically rules out any hope investors and traders had for a half-point rate cut to the target range for the Fed Funds Rate on Sept. 18. In fact, if one were to believe the revision to the GDP without any reservation at all, one might ask why rate cuts are even being considered in the first place.
Does that make this morning's July personal consumption expenditures data more important than usual? It could, I mean if we thought there might be some surprise on the offing. Given how late in the month this report is released, there are rarely any large surprises uncovered when these numbers hit the tape.
Have You and Your Friends Felt 3% Growth?
Here we go again. Government numbers that just do not add up. Oh, and here we go again. All we heard from the financial media on Thursday was how second-quarter GDP growth was revised to 3% (quarter over quarter, seasonally adjusted annual rate) from 2.8% as personal consumption expenditures were revised up to 2.9% from 2.3%. That's all well and good, coming off of a 1.4% GDP print for the first quarter.
The obvious problem that no one in the financial media dares mention, is that we also got our first estimate for second quarter gross domestic income on Thursday and as we all know by now, especially if you've been reading my stuff for a while, is that GDI must equal GDP, both in conception and algebraically. This is not some obscure item. The Fed considers GDP and GDI to be equal in terms of measuring economic growth and even recommends averaging the two when they are not close in order to roughly estimate the pace of national economic activity. That's why the average of the two is printed in the GDP release. I know digging into the data is a lot to ask of our "financial journalists," so I'll make it easy for them.
In the BEA GDP release, GDI is on Table 1, line 27. The average of GDP and GDI is found on line 28. Now, you have no excuse for the lack of effort. By the way, GDI printed at second-quarter growth of 1.3% (q/q, SAAR) coming off of growth of 1.3% for the first quarter. The average of GDP and GDI for second quarter is 2.15% growth. By no means an economic disaster, but to say that the economy grew 3% when even the Fed warns against doing so, is both dishonest and disingenuous.
Readers will recall that for all of 2023, GDP was up 2.5%, while GDI was up just 0.4%, barely skirting recession. Which one of those sounds more realistic, given what you are seeing and hearing?
Readers will recall that for all of 2023, GDP was up 2.5%, while GDI was up just 0.4%, barely skirting recession. Which one of those sounds more realistic, given what you are seeing and hearing? GDP for quarters one and two of this year has now printed at growth of 1.4% and 3.0%. GDI for those two quarters has printed at growth of 1.3% back-to-back. Which one sounds more realistic? Everyone you speak to is hurting. That does not happen in a 3% growth economy.
While personal consumption expenditures were jacked, gross private domestic investment was revised significantly lower, residential investment was revised lower, exports were revised lower, imports were revised higher, and government expenditures were revised lower both at the federal and state levels.
Literally every single line item away from personal consumption expenditures was revised in a way that would reduce GDP in Thursday's report. Does it really make sense that the consumer became overtly aggressive in such an environment when we know labor markets that were never really that strong, have weakened? Just asking in the name of common sense and because can we really afford the luxury of trusting government data after what we know has happened at the Bureau of Labor Statistics since the start of 2023?
Looking Back ... to GDPNow
While the Atlanta Fed's GDPNow model was close enough for horseshoes and hand grenades on its GDP estimate for the second quarter, the New York Fed's model was at growth of 2.02%, and the St. Louis Fed's model was at 1.14% for that quarter. Maybe everyone else wasn't wrong. The St. Louis Fed's model has been running fairly tight with GDI for consecutive months now.
Fed Funds Futures
This morning, I see Fed Funds Futures that trade in Chicago, pricing in a 68% probability for a quarter-point rate cut on Sept. 18 and a 32% likelihood for a half point cut. There is currently a 71% chance, according to these markets, for one total basis point worth of rate cuts by the end of year with a 26% chance for more than that. A year from today, these markets show a 68% probability for at least 200-basis points worth of rate cuts from where the policy rate is now. You realize that these markets are pricing in crisis-level economic conditions, right?
Remember ... Stagflation
Hedgeye Risk Management's models, which I rely upon because the work is sound and updates are made in real time without concern for narrative, still expect consumer level inflation to accelerate again to some degree late this autumn or early this winter, and that will be from still elevated levels. That will also be without a renewed acceleration in economic activity. So, there is very possibly, even likely, some stagflation or stagflation as Doug Kass likes to say, in our medium-term future.
Marketplace
The early rally and subsequent rug pull left U.S. equity markets close enough to unchanged to maybe slightly lower on Thursday, but on strong looking breadth, which is a little awkward. The S&P 500 really did close as close to unchanged as I think possible in this algorithmic market, down far less than one point. The Nasdaq Composite and Nasdaq 100 gave up 0.23% and 0.13% respectively. The small caps outperformed with the Russell 2000 up 0.66%, and the Semis underperformed. The Philly Semiconductor Index was down 0.6%.
Eight of the 11 S&P sector SPDR exchange-traded funds closed in the green with the cyclicals significantly outrunning the defensives and growthy types. Energy XLE led the way, up 1.3%, while Technology XLK came in last place for the day, down 0.9%.
Breadth was great for the day. Winners beat losers by a rough 9 to 4 at the New York Stock Exchange and by about 3 to 2 at the Nasdaq. Advancing volume took a 64.5% share of composite NYSE-listed trading volume and a 63% share of composite Nasdaq-listed activity. Trading volume in the aggregate was up small on a day over day basis for NYSE-domiciled names, but a stronger 9.9% for Nasdaq names. S&P 500 specific trading volume increased for a second straight trading day but is still well below its 50-day trading volume simple moving average.
News Flow: ULTA, LULU, and the Big Retailers
- Ulta Beauty ULTA missed on earnings, missed on revenue, while comp sales decreased. The stock fell sharply overnight. Don't forget. The consumer is strong.
- Lululemon Athletica LULU may be trading higher overnight, but did miss on revenue and guided revenue for both the current quarter and full year below consensus. The consumer is strong. Stick to that story.
- Walmart WMT, Target TGT and Costco COST are all kicking tail. Just saying.
In Other News...
- Barrons is reporting that Apple and Nvidia have discussed joining Microsoft MSFT as investors in OpenAI, the startup behind ChatGPT. OpenAI has already announced plans to move into search, which would pressure Alphabet GOOGL. Much more to come as this story develops.
- According to Bloomberg News, beleaguered former semiconductor king, Intel INTC is said to be exploring the possibility of splitting its foundry business and scrapping projects to build new factories. This, one would think, would be another huge embarrassment for the firm and its current C-suite.
Economics (All Times Eastern)
8:30 - Personal Income (July): Expecting 0.2% m/m, Last 0.2% m/m.
8:30 - Consumer Spending (July): Expecting 0.5% m/m, Last 0.3% m/m.
8:30 - PCE Price Index (July): Expecting 0.2% m/m, Last 0.1% m/m.
8:30 - Core PCE Price Index (July): Expecting 0.2% m/m, Last 0.2% m/m.
8:30 - PCE Price Index (July): Expecting 2.5% y/y, Last 2.5% y/y.
8:30 - Core PCE Price Index (July): Expecting 2.6% y/y, Last 2.6% y/y.
9:45 - Chicago PMI (March): Expecting 44.5, Last 45.3.
10:00 - U of M Consumer Sentiment (Aug-F): Flashed 67.8.
10:00 - U of M Consumer One Year Inflation Expectations (Aug-F): Flashed 2.9%.
10:00 - U of M Consumer Five Year Inflation Expectations (Aug-F): Flashed 3.0%.
1:00 p.m. - Baker Hughes Total Rig Count (Weekly): Last 585.
1:00 - Baker Hughes Oil Rig Count (Weekly): Last 483.
The Fed (All Times Eastern)
No public appearances scheduled.
Today's Earnings Highlights (Consensus EPS Expectations)
Before the Open: DOOO (.44)
At the time of publication, Guilfoyle was long NVDA, WMT, MSFT equity.
