The Bull and Bear Tug of War
The indicators are all over the place. Let's take a look to see what we can make of this either/or market.
You've reached your free article limit
You've read 0 of 1 free Pro articles.
In the last five trading days, the S&P and Nasdaq have been green every single day. The S&P has rallied five percent while the Nasdaq has tacked on six percent. And what of the Russell 2000? Flat as a pancake.
I’d like you to think of that when you look at the Overbought/Oversold Oscillator today. It has barely budged since we got that big whoosh down just over a week ago. That is the result of an Either/Or Market, but as you can see, if the mega-cap tech names/index movers move, then the major indexes move. If it’s small caps you want to move, you need this Oscillator to get oversold.
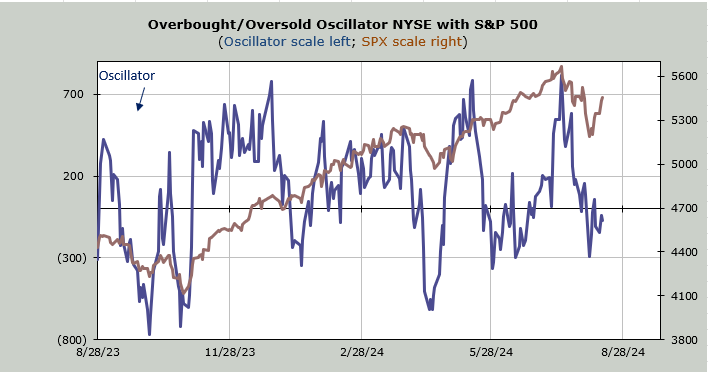
I do expect in the next few trading days—again, it is the math—that we will see this rise, and maybe even rise sharply. But after that, this should be back to an overbought condition which is why I keep noting that I think next week ought to see a pullback.
Can my timing be off because the index movers have already moved? Sure. Recall in late July, I thought we’d get one more rally before a swoon, but instead, we got exactly one day of rallying before the swoon.
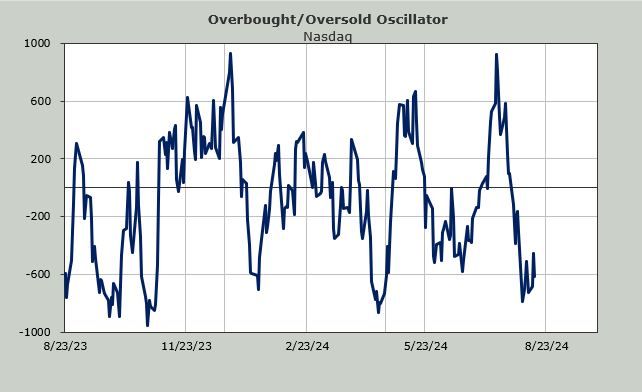
I must admit, I don’t think I have ever seen a market with the indicators all over the place as they are now. The shorter-term Oscillator is still a little bit oversold. The intermediate-term Oscillator is overbought.
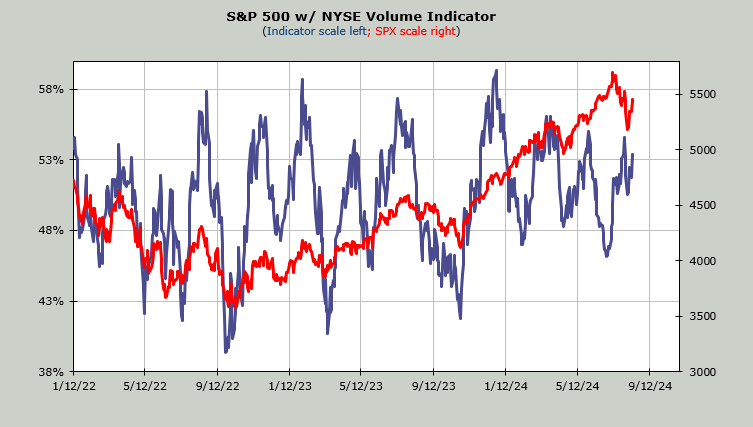
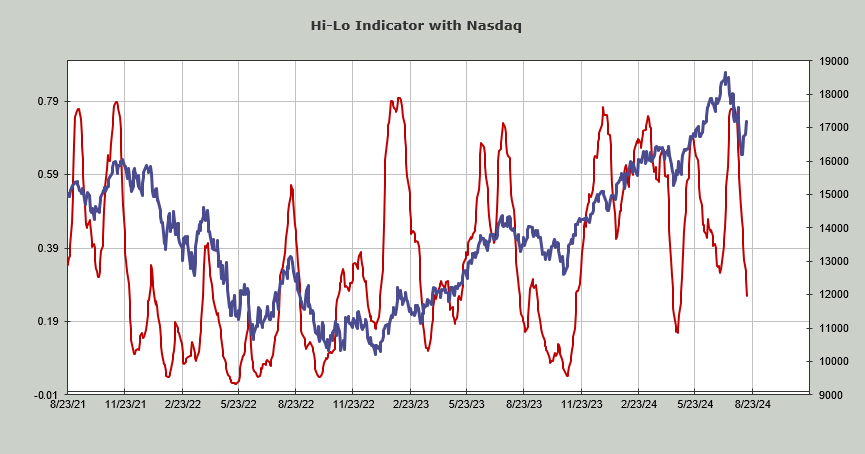
The intermediate-term Volume Indicator is at 53%, which leans on the overbought side (under 47% is oversold), while the Nasdaq Hi-Lo Indicator is now at .26, almost oversold (under .20 is oversold).
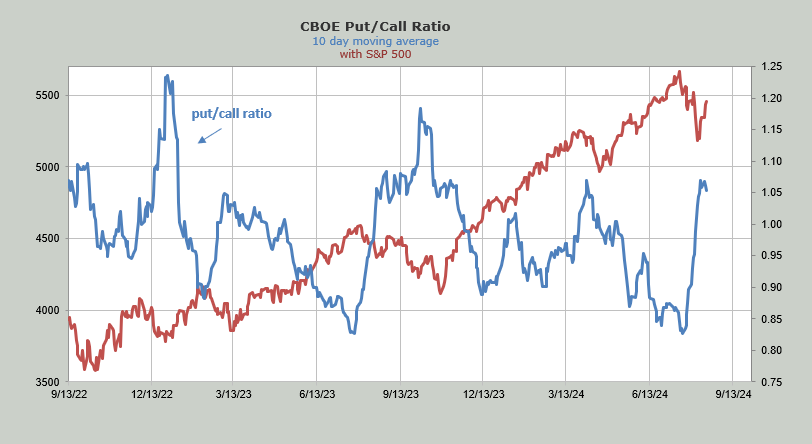
Then there is sentiment. The daily reading for the put/call ratio was .89 on Wednesday which isn’t terribly low but is the lowest reading we’ve seen since July 22nd so I take that as a change in that folks are feeling a bit better about the market (of course they are, we’ve been green in the big cap indexes for five straight days).
When we look at the ten-day moving average of the put/call ratio, it is trying to roll over and, therefore, should be considered bullish.
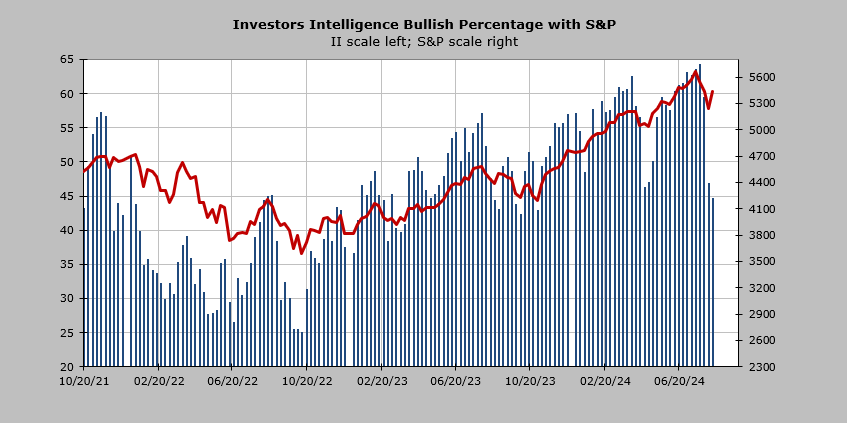
When we look at the Investors Intelligence bulls, we see they are now at 44%, which is actually lower than where they were in April and closing in on where they were at the October low. Thus, we put this on the bullish side of the ledger.
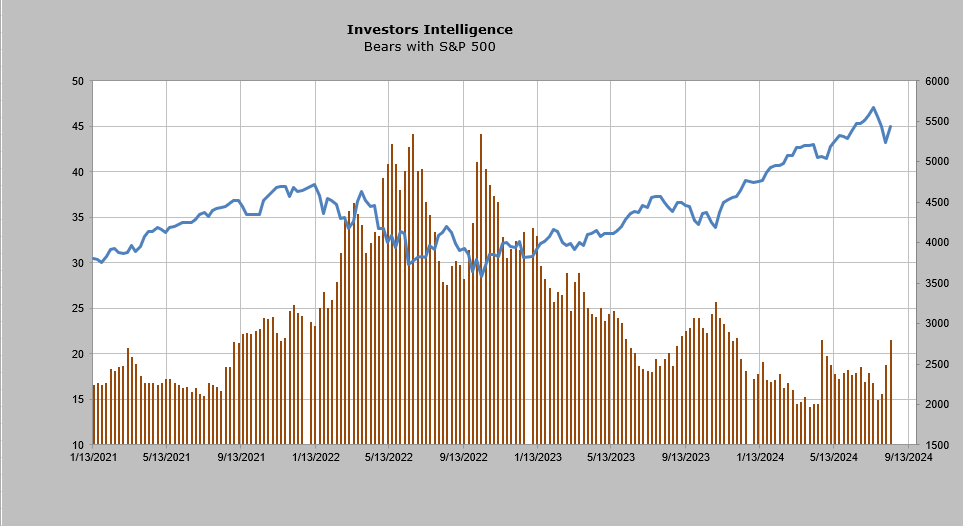
Even the bears ticked up to the highest reading since April.
I do expect when we see the American Association of Individual Investors’ survey on Thursday morning we’ll see the bulls back up and the bears back off since these folks tend to jump around like day traders. It will also be curious to see if the NAAIM folks increased their already high exposure.
