The Bounce Didn't Dent the Bearish Trend
Here's why I'm still cautious, despite some green this week, and the possibility of more bounce.
You've reached your free article limit
You've read 0 of 1 free Pro articles.
All the major equity indexes closed higher yesterday with positive New York Stock Exchange and Nasdaq internals as trading volumes dipped from the prior session.
But we aren't out of the woods yet.
Indeed, we see several signs that keep long-term bearish trends in tact.
First, the bounce generated no technical events worth noting.
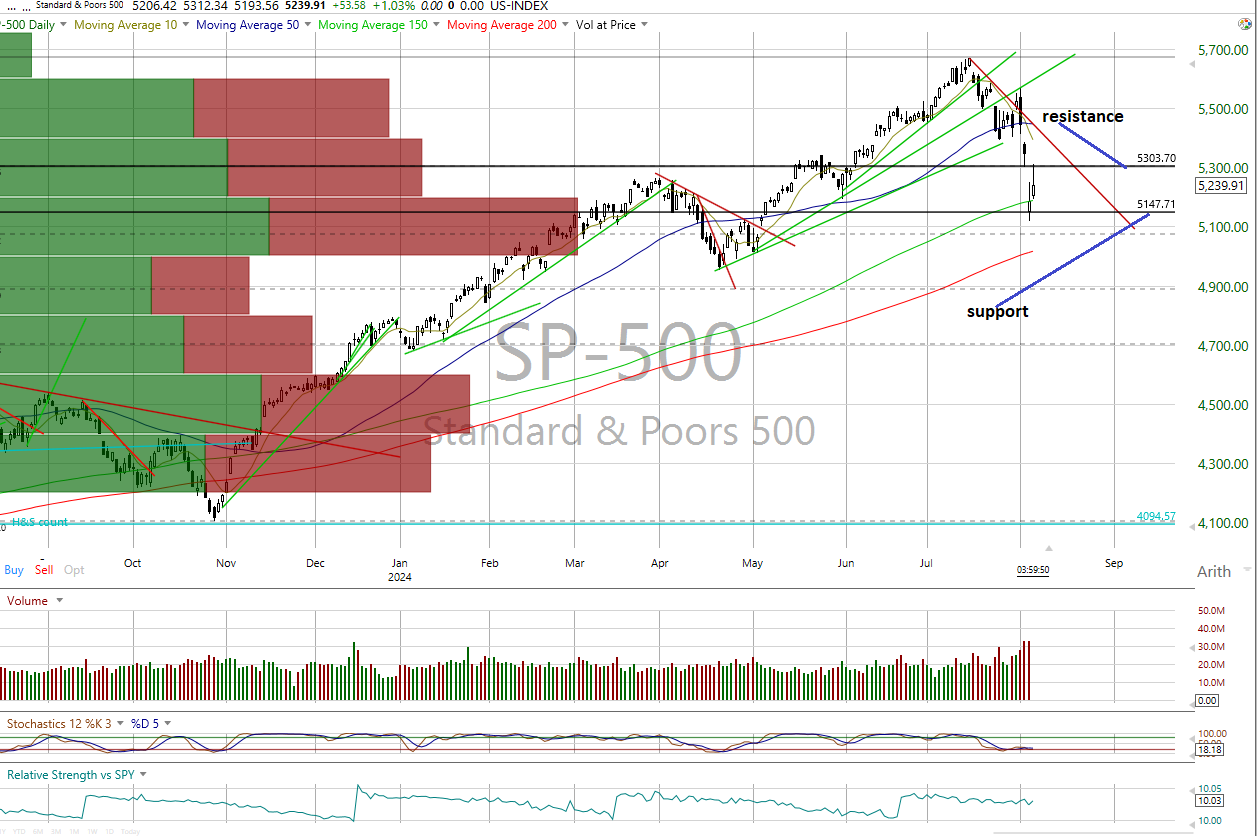
True, the McClellan one-day overbought/oversold oscillators that predicted yesterday’s gains remain oversold and suggest the potential for some further strength. (All Exchange: -64.52 NYSE: -54.09 Nasdaq: -72.39) Yet we would note that the positive futures this morning lifted the indexes to high volume resistance levels. Those higher resistance levels should stand a good chance of making further gains difficult.
Also, the warning signals from the sentiment data have cooled a bit but forward valuation of the S&P 500 based on 12-month forward earnings estimates from Bloomberg remain extended. The 12-month consensus earnings estimate from Bloomberg dropped to $251.77. That leaves its forward price-to-earnings of 20.8 still well above the “rule of 20” ballpark fair value at 16.1. Its earnings yield slipped to 4.58.
We believe this premium remains significant, and valuation is still a concern. So, despite yesterday’s pop, we are not yet convinced the current market correction has seen its nadir. Caution remains appropriate.
The Charts
On the charts, all the major equity indexes closed higher yesterday with positive internals as all closed near the midpoint of the day’s range. We need to see more evidence, however, before becoming more positive.
The trends should be honored until proven otherwise and we saw no stochastic readings worth talking about.
The percent of S&P issues trading above their 50-day moving averages, a contrarian indicator, rose to 49% and is neutral.
The detrended Rydex Ratio, which is also a contrarian indicator, dropped to a neutral 0.67.
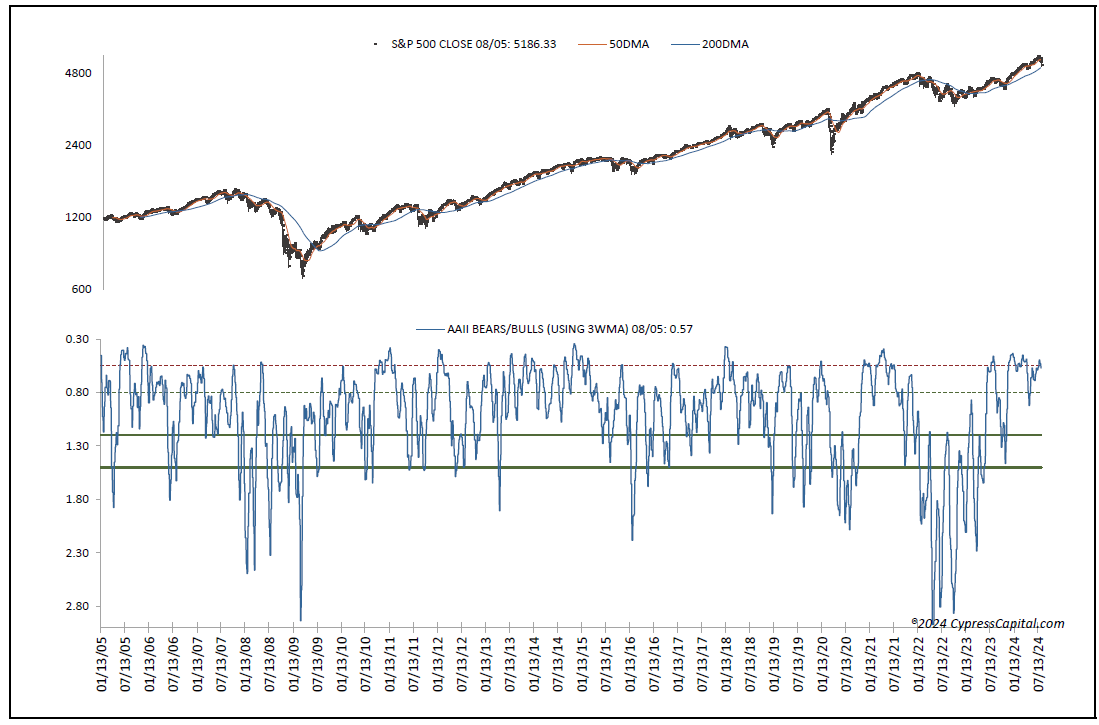
This week’s American Association of Individual Investors Bear/Bull Ratio, which is another contrarian indicator, moved to neutral from bearish at 0.57 as the Investors Intelligence Bear/Bull Ratio stayed bearish at 25.85% as bulls continued to outweigh bears by a wide margin. We continue to believe the “wall of worry” still needs to be rebuilt.
The Open Insider Buy/Sell Ratio turned neutral from bearish at 31.0% as insiders did some buying.
Treasuries and the Buck
The 10-year Treasury yield rose to 3.89%. Support is 3.69% and resistance at 3.98%. Its near-term trend is bearish.
The U.S. dollar, via the DB U.S. Dollar Index Bullish Fund UUP, closed higher at $28.41. Its trend is bearish with support at $28.30 and resistance at $28.53.
The Bottom Line
In conclusion, yesterday’s and today’s strength, may be a technical bounce, in response to the McClellan overbought/oversold oscillators, within an ongoing correction. The gains are moving the indexes to high volume resistance that we suspect will prevail. Valuation remains problematic. Be careful out there.