Tesla Shareholder Vote, Dovish Macro, Back-to-Back Bearish Signals
Pretty and ugly? Strong and weak simultaneously? A continuously narrowing rally is what we have.
You've reached your free article limit
You've read 0 of 1 free Pro articles.
It happened after the bell.
Tesla TSLA shareholders voted to approve (or re-approve) CEO Elon Musk's whopping $56 billion pay package and to re-incorporate the firm in the state of Texas, leaving the state of Delaware. These results, which were announced in Austin last night, will strengthen the company's position in its attempt to overturn a Delaware court's decision to void Musk's 2018 compensation package that included a bounty of TSLA options.
The court's reason for trying to veto the largest pay package in U.S. history was its concern over the independence of the firm's Board of Directors. This shareholder re-vote does not vacate the court's decision in Delaware, but through this re-ratification, could influence a reversal or some kind of amendment to that decision.
Should the pay package ultimately stand as was designed, Musk's stake in the electric vehicle manufacturer would pop from its current 13% to 20%.
TSLA was up 2.92% on Thursday but closed towards the low end of the daily range. The stock is up another percentage point plus overnight.
It Happened Thursday Morning
On Thursday morning, some more macroeconomic results crossed the tape following May's CPI report on Wednesday that would leave traders and investors with images of dovish central bankers dancing in their heads. Now, that's an image that I did not need in my head working through the zero-dark hours Friday morning.
First, weekly state-level initial jobless claims printed at 242K, up from 229K a week prior and well above the 225K that economists were looking for. Remember, unemployment kissed the 4% level for the first time since January 2022. This was the largest week-over-week increase in first-time unemployment filings since this past August, and according to the data, was largely due to a large increase from the state of California and a second consecutive week of elevated claims from the states of Pennsylvania and Minnesota.
The raw or non-seasonally adjusted data for the week (ended June 8) showed first-time claims of 234,707, an increase of 38,530 from the week ended June 1. Pennsylvania has acknowledged layoffs in transportation and manufacturing, while Minnesota has acknowledged layoffs in education. Was California a one-time glitch in the data that we do see from time to time? Remember, California's new law mandating a $20 per hour minimum wage became effective in April. This could be the very beginning of the largely expected negative impact of that law on lower-income laborers in that state.
Continuing jobless claims increased nationally for a sixth consecutive week and are back above 1.8M, up 2.8% over that time and up 5% since bottoming back in January. Yes, the labor market is softer than it was, even if it appears historically strong if one ignores certain data-points while citing others. Oh, and in our world, of course, bad news is good... for risk assets. Usually.
There's More
Not only did a moderate spike in unemployment claims cheer some investors, at least those invested in a narrow set of assets that have been consistently moving in a northerly direction, but we got more good news on May inflation. The PPI or Producer Price Index, which includes wholesale pricing, printed considerably cooler than had been expected.
On a month-over-month basis, at the headline May PPI printed in contraction at -0.2, down from growth of 0.5% in April and below expectations for growth of 0.1%. At the core, May PPI printed flat (0.0%) from April, which was up 0.5 from March and below expectations for growth of 0.3%. The year-over-year prints hit the tape at headline growth of 2.2%, down from 2.3% and below consensus view for growth of 2.5%. At the core, the annual print landed at growth of 2.3%, down from April's 2.4%, which was also the expected pace for May.
So, is that it? Did the month of May show great progress in winning the war on inflation? It certainly does to some degree, look that way. Then again, roughly 60% of the drop in the headline print was due to the May decline in gasoline prices all by themselves. That could easily reverse. Core goods prices, it might be pointed out and actually was pointed out by Peter Boockvar in his work yesterday, actually increased 0.3% month over month. That's interesting. Peter also pointed out that unprocessed goods increased by 1.8% in May. If the disinflationary run that the economy, on the goods side has enjoyed for almost a couple of years now has bottomed, that could be problematic.
Fed Funds Futures
This (Friday) morning, I see the probability for a 25-basis cut rate cut on July 31 has increased to 12%, while the likelihood for a 25-basis point rate cut by September 18 has increased to 70%. The probability for 50 basis points worth of rate cuts by year's end is now up to 72%, while the probability for 75 basis points worth of rate cuts is up to 27%.
Thursday Markets
Pretty and ugly at the same time? Strong and weak simultaneously. Despite still rallying Treasury debt securities.
A continuously narrowing rally is what we have as investors continue to favor fewer and larger-cap names over all others. The S&P 500 gained 0.23% on Thursday, closing at (say it with me) a new all-time record. Again. The Nasdaq Composite gained 0.34%, closing at a record. The Nasdaq 100 closed at a record. The Philadelphia Semiconductor Index closed at a record. The beat goes...
For a second straight session a majority of the 11 S&P sector SPDR ETFs closed in the red, as five of these funds closed "up" for the day. Technology XLK led the winners again, up 0.79%, while Energy XLE led to the downside at -0.92%. Losers beat winners at the NYSE by a roughly 7 to 4 margin and by nearly 2 to 1 at the Nasdaq.
Advancing volume took just a 31.8% share of composite NYSE-listed trade and a 46.5% share of composite Nasdaq-listed trade. Aggregate trading volume decreased significantly on a day-over-day basis, across listing of both the NYSE and Nasdaq as well as across the memberships of both the S&P 500 and Nasdaq Composite. This does make the action somewhat less meaningful across equites.
A Horse of a Different Color?
Not so much. I showed readers what I thought looked like a "shooting star" on the daily chart of the S&P 500 on Thursday morning. A shooting star would be a one-day candlestick pattern reflective of a reversal out of an uptrend. Of course, I did note that I would have preferred that Wednesday's "shooting star" would have closed lower for the day instead of higher, as that would have shown more conviction in the late selloff.
Well, the S&P 500 did not sell off on Thursday. It tried, but it rallied off of the midday lows. That does not necessarily get us off the hook.
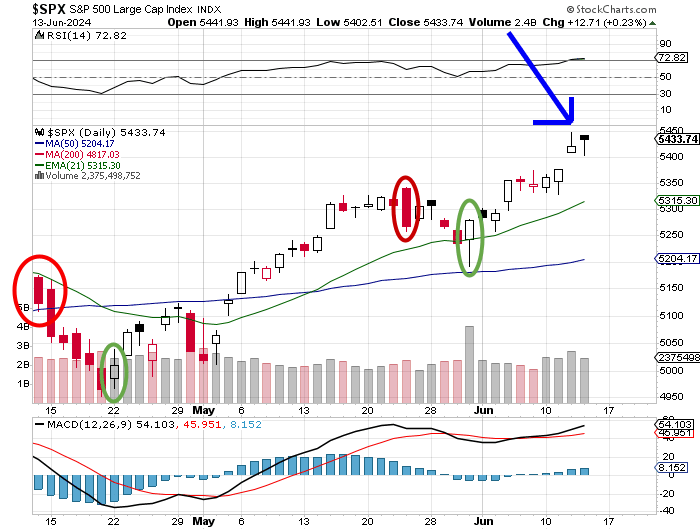
Wednesday's shooting star was followed by a "hanging man" on Thursday. A hanging man can occur on either an "up" or "down" day without impacting the strength of the signal given. A hanging man is also reflective of increasing volatility and when seen at the top of a chart like this is considered to be short-term bearish.
So, now, with Relative Strength slightly overbought, the daily Moving Average Convergence Divergence (MACD) extended at least for the 12-day and 26-day exponential moving averages (EMAs), and the index resting well above all of its key moving averages, we are looking at back-to-back bearish one-day signals. These can only be confirmed with a round of profit-taking on Friday (today). Sans such action, these patterns melt into something meaningless.
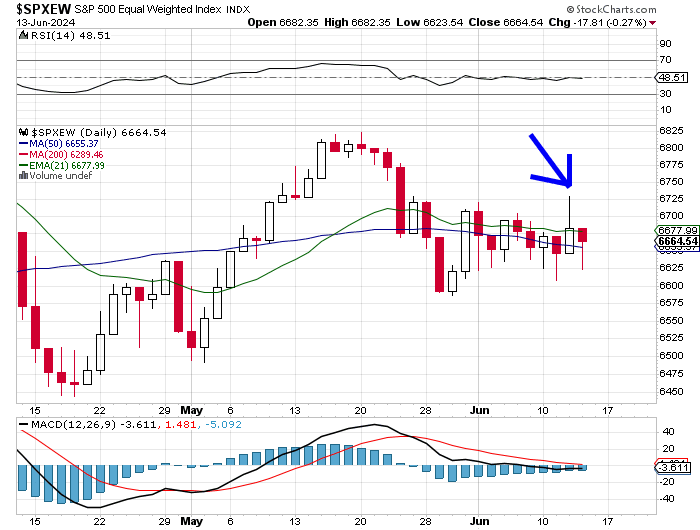
These one-day patterns are both present on the chart of the equal-weight S&P 500. The reason that they mean nothing here is that there has been no rally here. The broader market for large-cap equities sold off from mid-May into late May and has done nothing but run sideways all June long. Relative Strength is perfectly neutral, the daily MACD is sending no signal, and the index, when weighted in this way, is running congruently with both its 21-day EMA and 50-day simple moving average (SMA).
Interesting...
GE Aerospace GE sold off some 3.33% on Thursday in response to five-star rated (by TipRanks) analyst Seth Seifman of JP Morgan, who cut his second quarter sales estimates for the maker of jet engines to a Wall Street low $8.4 billion. Seifman, who left a "buy" rating and $175 target price on the stock, did not change his projections for EPS nor free cash flow.
That said, late Wednesday, GE Aerospace was awarded a potential five-year, $1.13B contract to provide T700 series turbine engines to the U.S. Army. The T700 series powers both the Sikorsky UH-60 Black Hawk utility and the Boeing BA AH-64 Apache attack helicopters. Sikorsky is a subsidiary of Lockheed Martin LMT.
Footnote: Personally, I'd rather rappel or fast-rope out of an old Bell UH-1 Huey than a modern Black Hawk anytime. Can't beat those landing skids for something to stand on.
Note to Readers: Just a friendly reminder that Monday is your quarterly income tax due date if you work for yourself or if you run the place.
Economics (All Times Eastern)
08:30 - Import Prices (May): Expecting 0.1% m/m, Last 0.9% m/m.
08:30 - Export Prices (May): Expecting 0.0% m/m, Last 0.5% m/m.
10:00 - U of M Consumer Sentiment (Jun-adv): Expecting 72, Last 69.1.
10:00 - U of M One Year Inflation Expectations (June-adv): Last 3.3%.
10:00 - U of M Five Year Inflation Expectations (June-adv): Last 3.0%.
13:00 - Baker Hughes Total Rig Count (Weekly): Last 594.
13:00 - Baker Hughes Oil Rig Count (Weekly): Last 492.
The Fed (All Times Eastern)
14:00 - Speaker: Chicago Fed Pres. Austan Goolsbee.
19:00 - Speaker: Reserve Board Gov. Lisa Cook.
Today's Earnings Highlights (Consensus EPS Expectations)
No significant quarterly earnings scheduled.
At the time of publication, Guilfoyle was long GE and LMT equity.
