Just a Little Oversold, Despite the Drop
The mega-caps led on the way up and the way down. Now, we need to give breadth time to catch up.
You've reached your free article limit
You've read 0 of 1 free Pro articles.
Well, that was disappointing. But it probably has more to do with the fact that we are still only a little bit oversold. I know the chart of the Overbought/Oversold Oscillator looks so oversold but the math behind it continues to say only a little bit.
It has to do with breadth. To get to a good oversold (short term) condition we need a long string of negative breadth days and right now in the last few weeks the most we have had is three consecutive red breadth days. And for the last ten trading days breadth has been red only six of them.
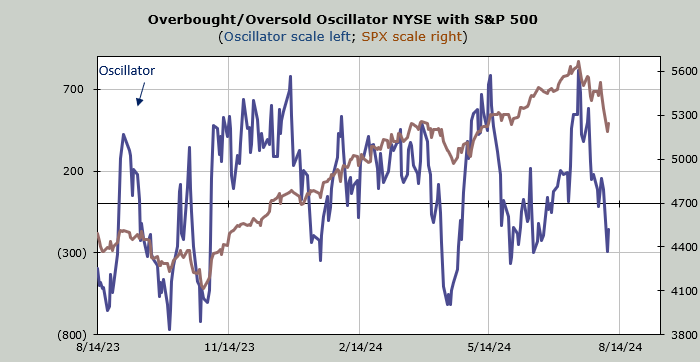
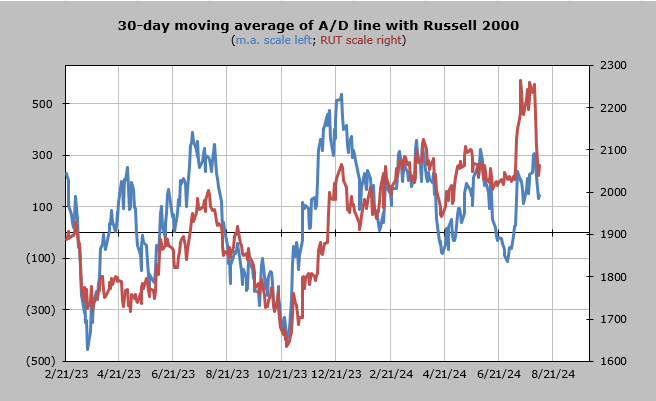
But let’s talk about the intermediate term indicators. Recall they only reached an overbought reading last week so it’s difficult to get them oversold that quickly. Look at the 30-day moving average of breadth (the advance/decline line). That’s the blue line. Does that look oversold to you?
Do you see where it was in late June? Or even April, when it was well below the zero line and had come down already. Right now we are well above the zero line and barely off the high.
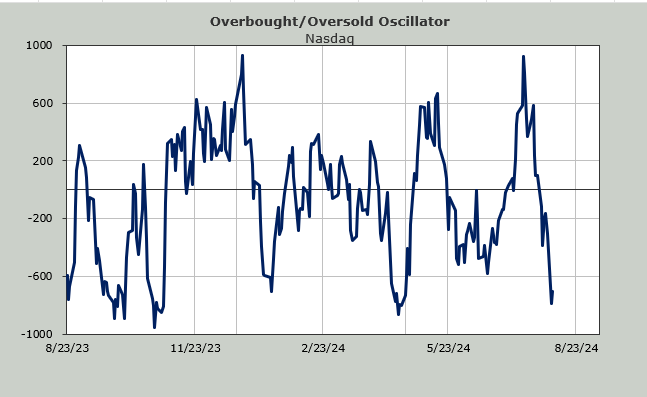
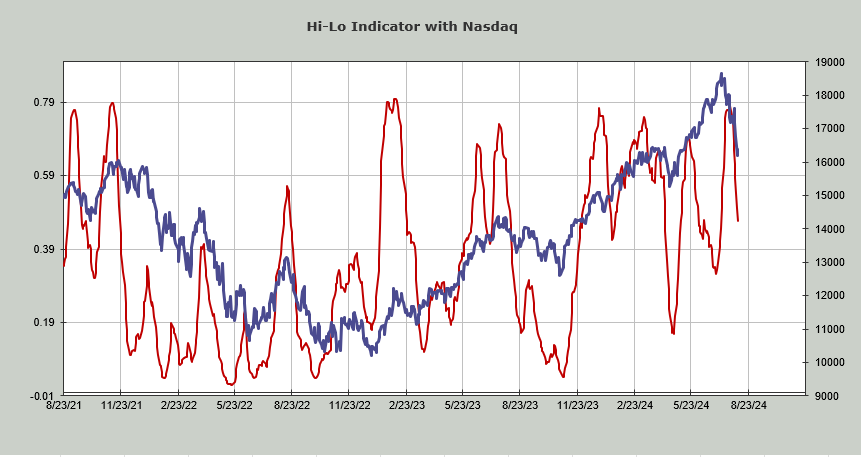
I know most of the damage has been over in tech land so let’s look at Nasdaq’s Hi-Lo Indicator. Despite the surge in stocks making new lows on Monday (nearly 600) this indicator was at .50 Monday and at the end of trading on Tuesday was .47.
Here too, we see we are well above the oversold reading in June and much above the oversold reading in April. We are heading there, but that takes time.
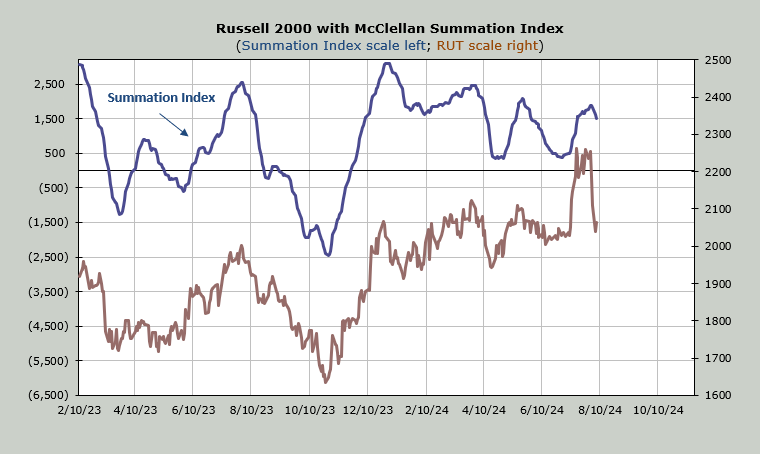
It helps if you look at the McClellan Summation Index and notice it has barely budged since it turned south last week. The indexes moved much faster than the indicators so there is a catch up period.
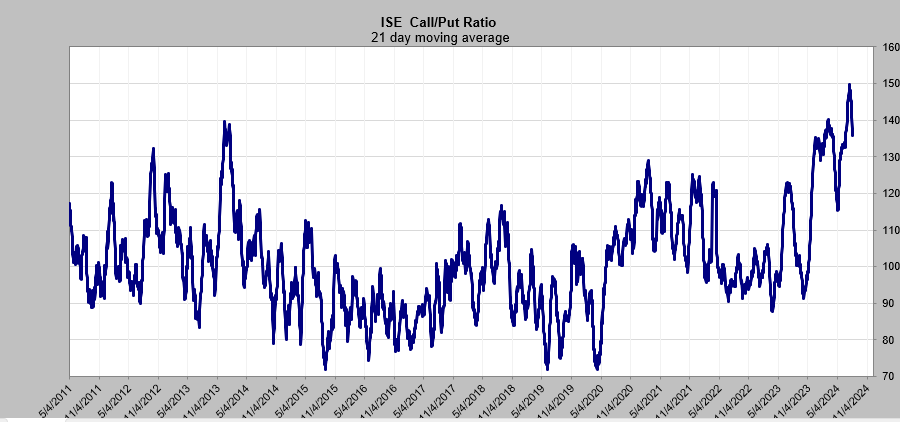
While it feels like all of a sudden everyone has gotten bearish, the 21-day moving average of the ISE call/put ratio is at 1.35 now, down from 1.50. It was 1.15 in April. Again, it has barely come down.
The indexes have moved much faster than the indicators mostly because the index movers are what drove this decline early on. Everything else only joined in late last week. Time is an important factor in the market and after the shock the market had this will take time to get the indicators oversold again.
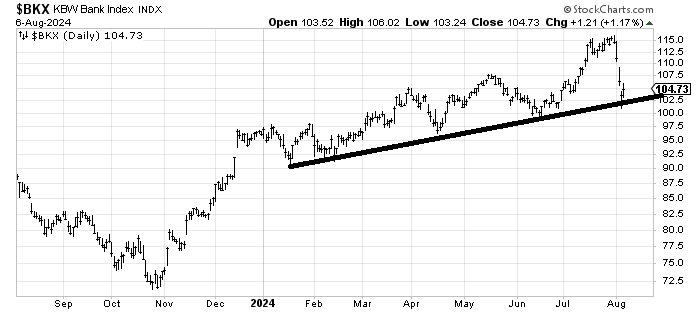
I do want to end by revisiting the Bank Index. As you know I turned sour on the banks when this tagged 115. It has since come down to the uptrend line and it has not (at least not yet) made a lower low than the June low.
If over the course of the next few weeks as the aftershocks work through the market this is still hanging in there relatively well, I would consider warming up to the banks again. Right now, I will wait to see what we look like as we get toward an intermediate term oversold condition.