It's All About Inflation
Let's dive into prices and what they mean -- and don't mean -- for the Fed's rate cut; also, MicroStrategy and Palantir among names slated for Nasdaq 100; and let's chart the markets.
You've reached your free article limit
You've read 0 of 1 free Pro articles.
The past week, from a macroeconomic perspective, as well as from a potential policy-focused market reaction, was all about inflation. There were not a lot of other domestic macroeconomic data-points out there, nor were there a ton of earnings released. There were no Fed speakers out and about as that group is currently in their media blackout period ahead of this Wednesday's events.
That left among a number of lower profile economic events, November consumer price index on Wednesday morning and November producer price index on Thursday morning. Anything to be afraid of? Let's just say this: While the data did nothing to knock this coming Wednesday's rate cut off course, it also did nothing to knock off course the probability that the Fed sits on its hands in January. In addition, the uncertainty around the March decision is as pronounced as ever.
Wednesday's Bureau of Labor Statistics report on November CPI came as a relief, that while there was certainly evidence that consumer-level inflation is accelerating, the headline print was not as hot as feared. On a month-over-month basis, headline and core consumer prices both grew 0.3% from October. At the headline, that was up from October's 0.2% prints as food inflation ran hot, especially food at home.
Looking at the year-over-year data, which is probably more important to economists, headline inflation printed at growth of 2.7%, up from October's 2.6% print, while core inflation ran steady at growth of 3.3%. The actual headline print, when doing the math, came to growth of 2.73% and was rounded down. I only point that out because I had written ahead of time that I expected to see a 2.8% print and that makes me a little less inaccurate.
Things only warmed up from there. On Thursday morning, on a month-over-month basis, headline November PPI printed at growth of 0.4%, up from 0.2% in October, while core PPI actually slowed to growth of 0.2% from October's 0.3% print. The headline month-over-month print tied November for the hottest month for the series since April. Food, which was also hot at the consumer level, as a category was up 3.1% at the producer level.
As for the year-over-year data, for November, headline PPI was up sharply to 3%, from October's 2.6% print, which was also up sharply from September's 2.0% print. Core year-over-year PPI hit the tape at a second consecutive month of 3.4% after bottoming at 2.6% this past summer.
The Nasdaq 100
On Friday night, the Nasdaq announced the winners and losers of its annual reconstitution of its Nasdaq 100 Index. The Nasdaq 100 for the new kids is an index composed of the largest 100 non-financial corporations listed at the Nasdaq Market Site and is considered for that reason to be tech heavy. Addition to, or deletion from the Nasdaq 100 is important, because the Nasdaq 100 is widely followed and a number of funds must, by mandate, adjust their holdings and weightings of their holdings according to the constitution of the index. The index is weighted by market cap.
On with the news ... Long-time Sarge favorite Palantir Technologies PLTR, MicroStrategy MSTR and Axon Enterprise AXON will all be added to the Nasdaq 100 ahead of the opening bell on Monday, Dec. 23. That's a week from today. Palantir was also added to the S&P 500 this year, which is one reason that the stock is up 343% year to date. Being deleted from the Nasdaq 100 are Super Micro Computer SMCI, Moderna MRNA, and Illumina ILMN. Super Micro Computer is not only being deleted from the prestigious Nasdaq 100 but is also facing a February deadline to file its late annual report and could face being delisted from the Nasdaq altogether.
The Week That Was
In addition to the November data on inflation....
- Bitcoin held the $100,000 per token level and moved on after having struggled with taking that level for weeks despite the US Dollar Index moving higher and piercing the 107 level.
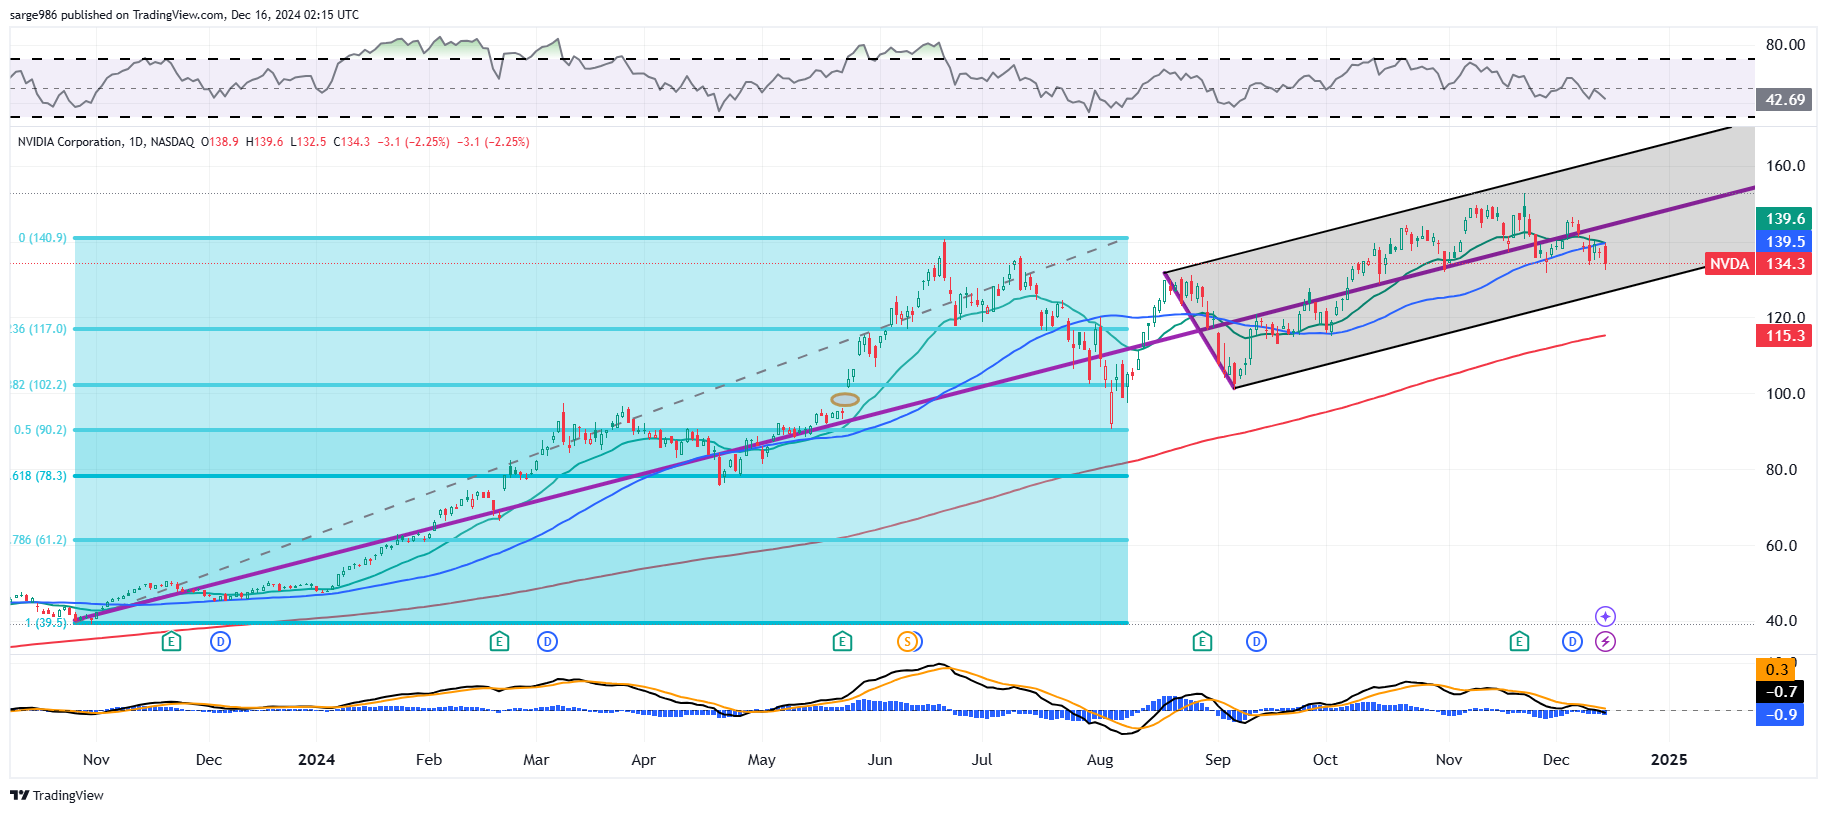
- On Monday, the mainland Chinese government in Beijing launched an antitrust investigation into US high-end chip designer Nvidia NVDA.
Should NVDA lose contact with both its 21-day exponential moving average and 50-day simple moving average, while the former crosses under the latter, creating a "swing trader's death cross," I will feel forced to reduce long-side exposure and would expect other portfolio managers to do so as well.
- Also on Monday, oil and gold futures surged in response to the unexpected collapse of the Assad regime in Syria. Gold gave back much of the gains as the week wore on, but crude held the rally into the weekend.
- On Wednesday, the Nasdaq Composite topped the 20,000 level for the first time in its history but could not hold the level going into Friday evening.
- On Saturday, the Army was slapped around by Navy in the 125th playing of the Army Navy game in Landover, Maryland to bring the Commander-in-Chief's Trophy back to Annapolis for the first time since 2019.
Marketplace
The story of the week, or really for a couple of weeks, has been the breadth. While the headline indices really have not suffered much, the mid-major equity indexes to include the small to mid-caps have been pushed around more than was Army's defensive front on Saturday. The S&P 500 saw its three-week winning streak come to an end, even if not by much, while the Nasdaq Composite was able to push that winning streak to four weeks... even if not by much. The lower down on the food chain we went, the uglier things got.
Yields for the One Year T-Bill on out to the deep end of the pool worked their way higher all week. The US Ten Year Note paid just 4.19% on Tuesday and as much as 4.4% on Friday. However, with expectations for a rate cut at this Wednesday's FOMC dog and pony show, yields for six-month US paper on down to thirty-day paper all worked their way lower.
As for the major to mid-major U.S. equity indexes last week ...
- The S&P 500 gave up less than a smidgen on Friday to close the week down 0.64%.
- The Nasdaq Composite gained 0.12% on Friday to close the week up 0.34%.
- The Nasdaq 100 gained 0.76% on Friday to close the week up 0.73%.
- The Russell 2000 gave up 0.6% on Friday to close the week down 2.58%.
- The S&P Small Cap 600 gave up 0.64% on Friday but closed the week down 1.46%.
- The S&P Mid Cap 400 gave back 0.54% on Friday, to close the week down an 1.63%.
- The Dow Transports gave up 0.78% on Friday to close the week down an even 1%.
- The Philly Semiconductors soared 3.36% on Friday to close the week up 1.75%.
- The KBW Bank Index gave back 0.44% on Friday to close the week down 2.85%.
On Friday, only three of the 11 S&P sector SPDR exchange-traded funds closed in the green, with Technology XLK out in front at just 0.43%. Communication Services XLC led the losers at -1.19% for the day. For the week, still only two of the eleven S&P sector SPDR ETFs closed in the green, led by the Discretionaries at +1.16%. our second-place finisher, Communication Services, only gained a penny for the week, so claiming there were two winners is almost misleading. Five of these funds gave up more than 2% for the week, the Materials XLB led to the downside.
Will They Cut?
Yes, they will. According to Feds Funds Futures markets trading in Chicago, there is now a 93% probability priced in for a quarter-percentage point cut to be made to the target range for the Fed Funds Rate this Wednesday. That's down from a high of 98% just after the release of the CPI data last Wednesday. and would take that target range down to 4.25% - 4.5%. The likelihood for no rate cut on Jan. 29 is up to 95%, while the expectation for another 25-basis point rate cut on March 19th stands at 59%.
The GDP Game
This Thursday, the BEA will release their third and final estimate for Q3 GDP. After the first revision a month ago, Q3 GDP showed growth of 2.8%, while Q3 GDI showed growth of 2.2%. Now, for the current quarter.
Last week, the Atlanta Fed left their GDPNow model for the fourth quarter at growth of 3.3 (q/q, SAAR). Among other central banks running close to real-time GDP models for the current quarter, the New York Fed cut its estimate for Q4 growth to 1.85% from 1.89%, while the Cleveland Fed still sees Q4 growth of 1.84%. The St. Louis Fed revised their model for Q4 GDP growth up to 1.33% from growth of 1.24%.
It is what it is. The Atlanta Fed is the outlier right now, way out of line and far above the other three regional Fed branches modeling national GDP. Either Atlanta is way too optimistic or everyone else is way too pessimistic... or maybe they're all wrong. Atlanta will revise their model three times this week, later this morning, tomorrow morning and Thursday morning.
Less Positive Charts Than Last Week
As for the S&P 500 and the Nasdaq Composite look to have possibly (too early to tell) entered into basing periods of consolidation.
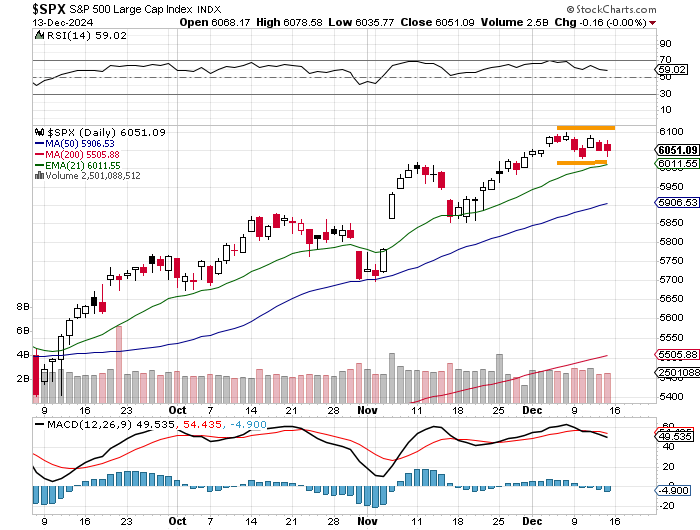
Readers will see that after the confirmation of the upward trend that we pointed out here in mid-November, both of our major equity indices had tested support at their respective 21-day EMAs before moving higher.
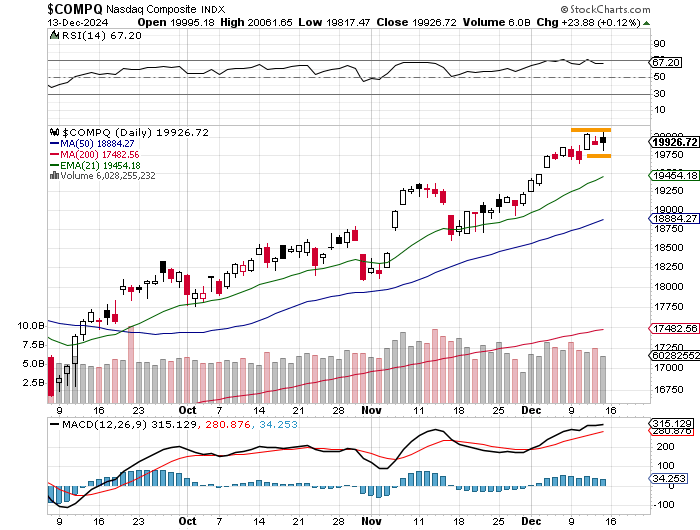
Neither the S&P 500 nor the Nasdaq Composite look to be flirting with readings for Relative Strength that would appear to be technically overbought. Instead, both RSIs have moved towards neutral. While the Nasdaq Composite can still sport a bullish looking daily Moving Average Convergence Divergence indicators (below the charts) where all three components (9-day, 12-day, and 26-day EMAs) stand well above the zero bound and the 12-day line has accelerated above the 26-day line, this cannot be said for the S&P 500. For the broadest of large cap indices, the daily MACD has turned bearish.
Last Week's Negative Charts Nailed It
Last week, we pointed out that below, charts covering the same time period as those above had shown the iShares Russell 2000 ETFs and the Dow Jones Transportation Average had developed what had started to look like double top reversals. Seasonality has not been an issue thus far to smaller cap stocks nor for certain narrowly defined mid-major indexes.
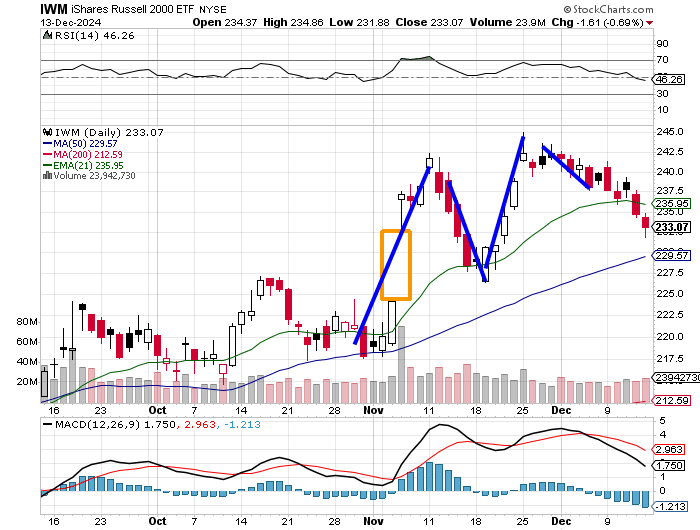
Readers will see that the IWM ETF still displays a neutral looking RSI, but now a much more bearish looking daily MACD with the 12-day EMA now running well below the 26-day EMA and the histogram of the 9-day EMA has well below zero.
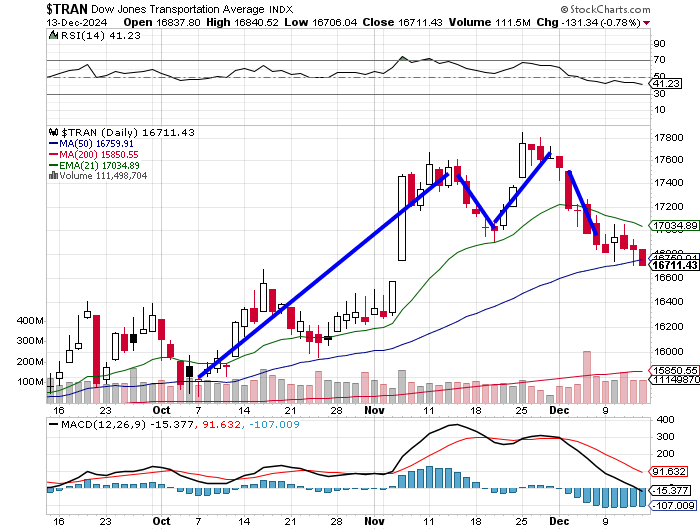
It's even worse for the Dow Transports. As I have pointed out, the smaller caps and the transports often run with GDP, so clearly there is now some disconnect between what the BEA and Atlanta Fed have been telling us and what investors are seeing. Remember, the New York, Cleveland and St. Louis Feds are all painting a less rosy picture for Q4 economic activity than is Atlanta. The Dow Transports are clearly further along in the slope of deterioration than are the small caps.
The Week Ahead
The final full five-day trading week of 2025 will be a busy one as far as macroeconomics and policy are concerned. The headline event of the week will be the Fed Policy Statement on Wednesday afternoon. A quarter-point rate cut is currently priced into markets. Until Wednesday, the Fed remains in its media blackout period. On Wednesday, along with the statement, the FOMC will release quarterly economic projections and Fed Chair Jerome Powell will hold his all-important post-decision press conference. Among other key central banks making decisions, both the Bank of Japan and Bank of England will step to the plate on Thursday.
Turning to the data, November retail sales, which will include data for Black Friday, but not Cyber Monday will hit the tape on Tuesday followed by November Industrial Production. Ahead of the Fed on Wednesday, the Census Bureau will release November numbers for Housing Starts and Building Permits. Then on Thursday, the BEA will revise their outlook for Q3 GDP one last time as the weekly data for initial and continuing jobless claims cross the tape. Finally, on Friday, we'll see data for November Personal Income & Spending as well as November data for PCE inflation. Remember, the financial media will play these numbers up for the sake of sensationalism, but given how late in the month, the PCE data is released, it rarely throws the street for much of a surprise.
Though we are technically in between earnings seasons, there will be enough names reporting their quarterly results this week, especially mid-week. On Wednesday morning, General Mills GIS will report, followed by both Lennar LEN and Micron Technology MU on Wednesday evening. Thursday morning brings results from Conagra Brands CAG and FactSet Research FDS, as we wait to hear from FedEx FDX and Nike NKE after the closing bell that day. On Friday, we'll hear from Carnival CCL.
Question?
- What on earth has happened to the New York Rangers?
Economics (All Times Eastern)
08:30 - Empire State Manufacturing Index (Dec): Expecting 6.4, Last 31.2.
09:45 - S&P Global Manufacturing PMI (Dec-F): Flashed 49.4.
09:45 - S&P Global Services PMI (Dec-F): Flashed 55.7.
The Fed (All Times Eastern)
Fed Blackout Period.
Today's Earnings Highlights (Consensus EPS Expectations)
No significant quarterly earnings scheduled.
At the time of publication, Guilfoyle was long PLTR, NVDA equity.
