Is the Correction Over? Don't Count on It
Let's look under the hood to see why most index charts appear bearish and valuation extended.
You've reached your free article limit
You've read 0 of 1 free Pro articles.
Let's see what happened under the hood after the close on Friday and why most charts look bearish -- and continue to point to a correction that hasn't ended.
The New York Stock Exchange internals were positive and Nasdaq’s were mixed. They closed near the midpoint to the high of their intraday ranges that saw two charts close above resistance. But their near-term trends were unchanged, leaving five of the seven charts in near-term bearish trends that we continue to honor until proven otherwise. Regarding market breadth, it remains neutral across the board. The data is generally neutral as well. But we remain concerned regarding the quite extended valuation of the S&P 500 vs. ballpark fair value. On the charts, the major equity indexes closed mixed on Friday as they closed near the midpoint to upper end of their intraday ranges.
On the positive side, the S&P and Nasdaq closed above resistance while the Dow Jones industrial average managed to close above its 50-day moving average.
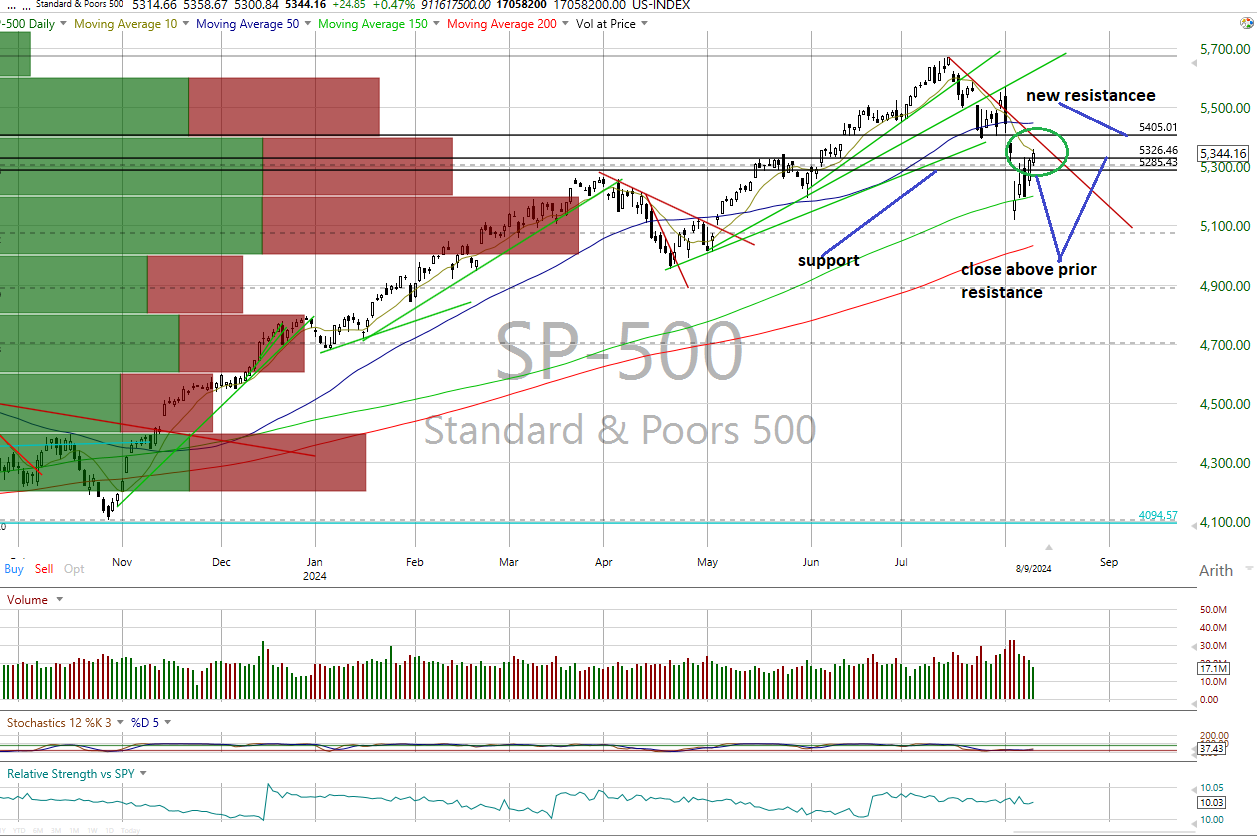
Importantly, however, none of the index near-term trends were altered so much that left the S&P, Dow Jones, Nasdaq and Nasdaq 100 and the Dow Jones Transports in downtrends that we continue to respect.
The Russell 2000 and mid-caps are still neutral.
Breadth and Daily Moving Averages
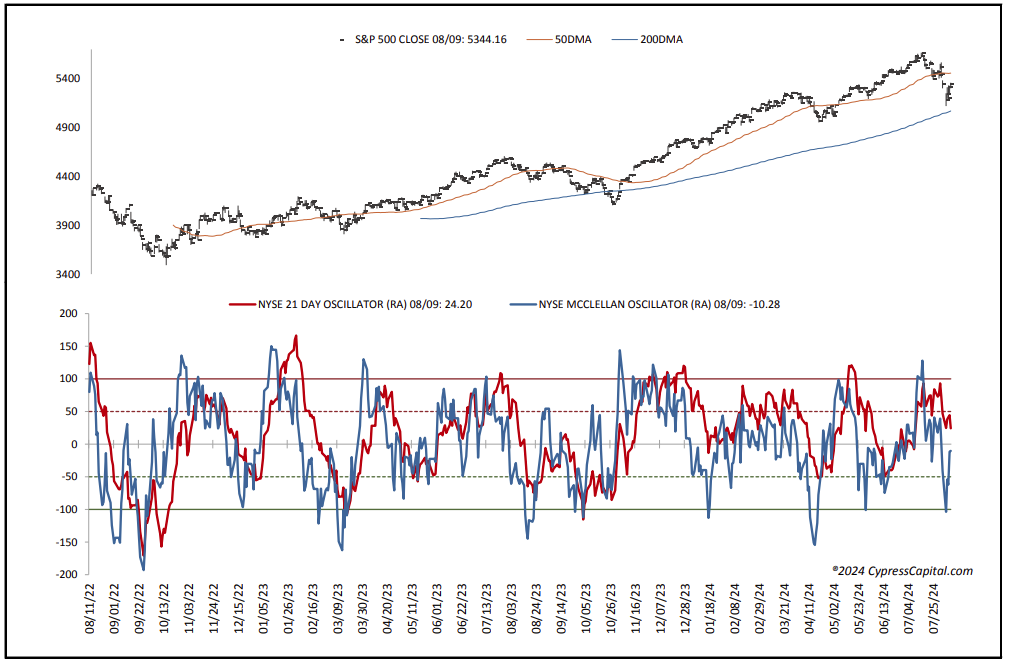
Cumulative market breadth for the All Exchange, NYSE and Nasdaq remains neutral while no stochastic signals of any significance were made.
The data is largely neutral, including the one-day McClellan overbought/oversold Oscillators (All Exchange: -26.39; NYSE: -10.28; Nasdaq: -37.39).
The percentage of S&P issues trading above their 50-day moving averages, a contrarian indicator, rose to 58% and is neutral.
The detrended Rydex Ratio, a contrarian indicator, rose to 0.63 and also neutral.
Sentiment Check
Last week’s American Association of Individual Investors Bear/Bull Ratio, a contrarian indicator, moved to neutral from bearish at 0.57 as the Investors Intelligence Bear/Bull Ratio stayed bearish at 25.85%, with bulls continuing to outweigh bears by a wide margin. We continue to believe the “wall of worry” still needs to be further rebuilt.
The Open Insider Buy/Sell Ratio rose to a neutral 42.5% as insiders did some slight buying.
Finally, valuation remains a concern. The 12-month consensus earnings estimate for the S&P from Bloomberg rose to $250.88. But that leaves its forward price-to-earnings of 21.3 still well above the “rule of 20” ballpark fair value at 16.1. We believe this premium remains significant. Its earnings yield dropped to 4.69.
The Buck
The 10-year Treasury yield slipped to 3.94%. Support is 3.79% and resistance at 4.0%. Its near-term trend is bearish.
The U.S. Dollar, via the U.S. Dollar Index Bullish Fund UUP ETF, closed lower at $28.57. Its trend is bearish with support at $28.30 and resistance at $28.60.
Bottom Line
Given the state of the charts, breadth and valuation, we view the recent gains in the equity markets as a rally withing an ongoing downtrend until enough evidence is presented to suggest otherwise. We need better developments to make that assumption.