Is It Time for Investors to Take a Break From Buying?
Here's why buying opportunities may be better down the road.
You've reached your free article limit
You've read 0 of 1 free Pro articles.
Time for a rest?
All the major equity indexes closed near their session highs Friday with several violating their near-term resistance levels, leaving all but two of the indexes in near-term bullish trends. Cumulative market breadth remains bullish as well.
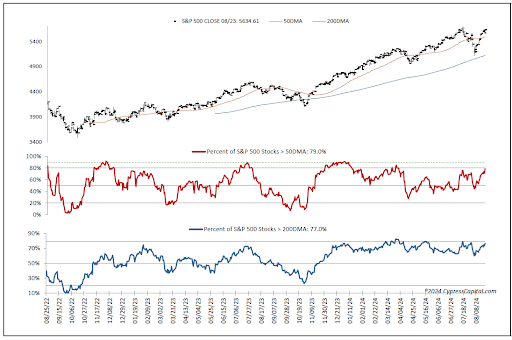
However, the data suggest we may be entering a period of some pause/consolidation, while the percentage of S&P 500 stocks above their 500-day moving averages is close to turning red (see below).
Several Indexes Violate Resistance
On the charts, all the major equity indexes closed higher Friday with positive internals and heavier trading volume.
All closed near their session highs with the DJIA, Dow Jones Transports, MidCap 400 and Russell 2000 closing above resistance, which shifted the Dow Transports' trend to bullish from neutral.
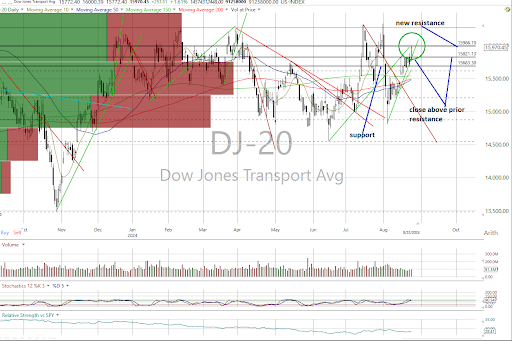
Only the Nasdaq Composite and Nasdaq 100 are in neutral trends with the rest bullish.
Cumulative market breadth remains positive on the All Exchange, NYSE and Nasdaq.
All the stochastic levels remain overbought but have yet to generate bearish crossover signals.
McClellan 1-Day Oscillators Overbought
The data are starting to send some cautionary signals.
All the 1-Day McClellan Overbought/Oversold Oscillators are back to overbought levels that suggest some pause/consolidation (All Exchange: +72.05 NYSE: +81.22 Nasdaq: +67.21).
The percentage of S&P 500 issues trading above their 50-day moving average (contrarian indicator) rose to 79%, which is just shy of the 80% level that has been a prophetic indicator ahead of corrections.
The detrended Rydex Ratio (contrarian indicator), however, dropped to 0.47 and neutral from bearish.
Last week’s AAII Bear/Bull Ratio (contrarian indicator) declined to 0.73, staying neutral.
However, the Investors Intelligence Bear/Bull Ratio (contrary indicator) stayed bearish at 30.89% with investment advisor bulls continuing to outweigh bears by a wide margin. We still believe the “wall of worry” could use some further strengthening.
The Open Insider Buy/Sell Ratio rose slightly to 27.8% and is neutral. Of note, they had been on the sell side most of last week.
Valuation Remains a Concern
The 12-month consensus earnings estimate for the S&P 500 from Bloomberg slipped to $250.78 per share. That leaves its forward P/E multiple of 22.5x still well above the “rule of 20 ballpark fair value at 16.2x. We believe this premium remains significant and presents some risk.
The S&P's earnings yield dipped to 4.45%.
The 10-Year Treasury yield dropped to 3.81%. Support is 3.70% and resistance at 3.94%. Its near-term trend is bearish.
The U.S. dollar, via the UUP ETF, closed lower and below support at $27.96. Its trend is bearish with new support at $27.94 and resistance at $28.23.
Bottom Line
The data are suggesting we should take a breather at the buy window as it suggests better buying opportunities have a reasonable potential of being offered over the near term. As always, we continue to honor sell signals on individual names.