Has Inflation Rung the Bell on a Stock Market Top?
A sharp rise in PPI could be the signal that bears have been looking for. Should investors care?
You've reached your free article limit
You've read 0 of 1 free Pro articles.

I saw a terrific statistic over the weekend. Basically, all the times in market history that inflation (PPI) was up this much year over year, and what the market did one year after that.
It turns out there are 22 instances (with last week being the 22nd, so we don’t know the outcome), and only five times (24%) was the market up one year later. I joked with the person who sent it to me that the bulls will glom onto 2005 (+2.7%) while the bears will glom onto 1923 (-15.4%).
But in reality, the real importance in this statistic is that 12 months hence, the market was lower 76% of the time. That matters because, in general, the market is up 75% of the time one year later. This is why all those stats that say 75% of the time the market was up a year later are useless to me. That is typical, so why highlight it? The standout is when you have a stat that says one year later, the market is lower 75% of the time. And that’s what this one says.
Which brings us to the bonds. That was a serious move in the bonds last week, and on Friday, folks finally started to care, or shall I say, tech stocks finally started to care. As I have explained, for the most part, the rest of the market has cared about the move in rates (see the low in rates in mid April?) and higher gas prices for a month now.
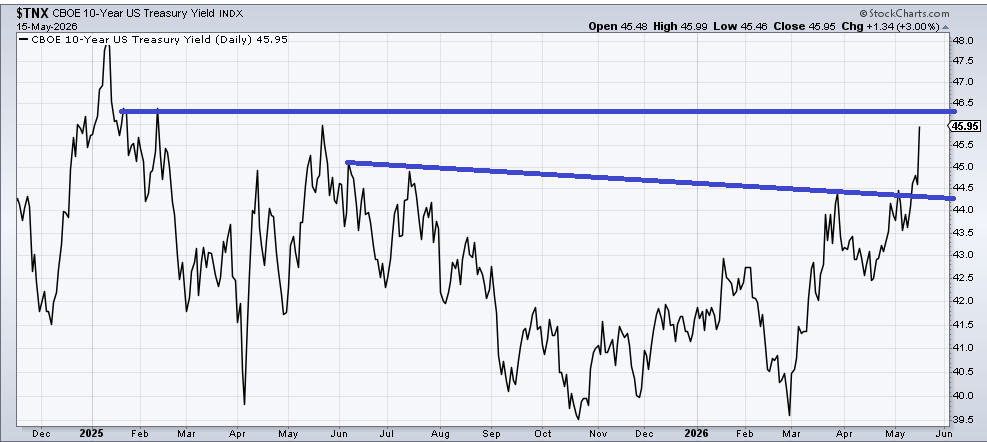
The yield on the 10-year will run into some resistance around 4.65%-4.75%, but I am always interested in sentiment. The Daily Sentiment Index (DSI) is at 22. It is my contention that if rates rise into that resistance zone, DSI will be a teenager in a hurry. That should be on our radar for the next few weeks.
Sticking with sentiment, over the weekend, I saw two new sentiment indicators. While last week I said that the options ratios were showing giddy, but the others were showing complacency, now I have two that show giddy.
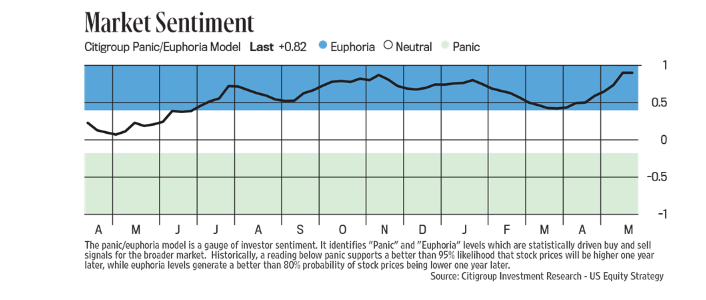
The first is the Citi Panic/Euphoria Model. The current reading is .82, which is well into Euphoria, but squint hard, and you can see that it is now higher than it was in October and again in January, both at/near market peaks.
Then there is the Market Vane Bulls. I think the last time I discussed this indicator was back in early 2025, when it pushed up to 73% because that was the highest reading we had seen since 2007. Of course, the Tariff Tantrum was right around the corner, and sentiment never got so bullish again. Until now.
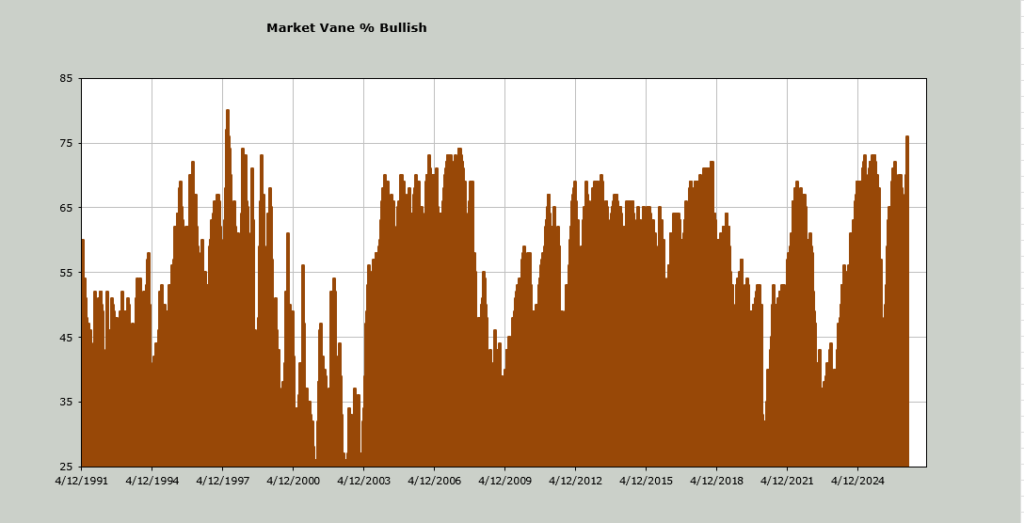
Now we find this at 76%, which means I had to go all the way back to 1997 (yes, that far!) to find a more bullish reading. Many will say that the market rallied on for two and a half more years after that (the reading came mid-year) of the bull market. They would be correct. However, after that high reading, the market went into a ten percent trading range for four months, culminating in October with a three-day ten percent whack that brought about so much panic.
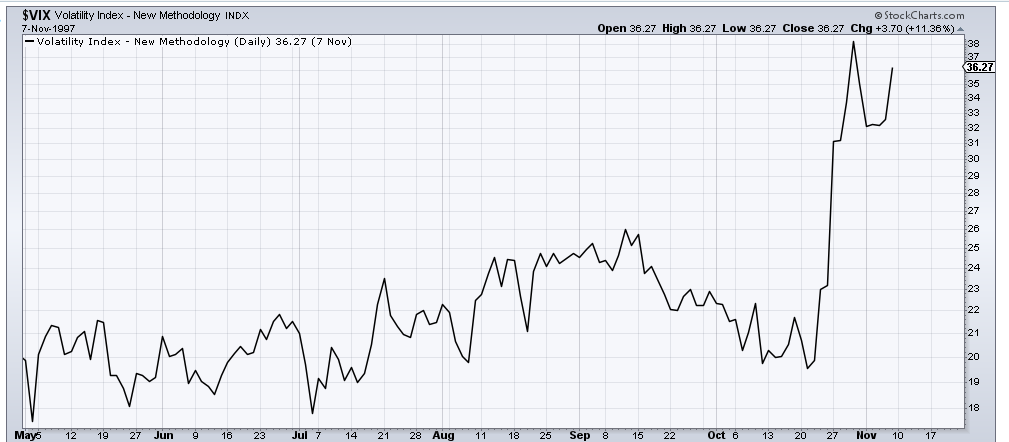
How much panic? Anecdotally, I remember Abby Joseph Cohen, who was then the Chief Strategist of Goldman Sachs, and known to be a perma bull, turned cautious. Statistically, the VIX went from 20 to 38 in a heartbeat.
Let’s not be complacent.