There’s Good News and Bad News
Let’s take a look at the positives and negatives within recent market action.
You've reached your free article limit
You've read 0 of 1 free Pro articles.

The Market
So, was that the mid-May decline, and we’re off to the races again?
Well, I can give you a little good news and a little bad news, but overall, I think at best it’s a slog from here, and more likely we should expect the volatility is not yet over.
Let’s start with the fact that the majority of stocks made their highs in mid-April. Look at so many stocks/groups, and you can see it easily. Well, many made their highs in February, but I am actually referring to the rally off the lows in late March.
Typically, when we get a rally off the lows, I will look for an initial surge that lasts a few weeks, followed by a short-term overbought pullback, followed by a renewed rally. It is the second rally that is the one where we decide if there is real strength to continue the rally or if that was all we’re getting.
During this recent rally, sometime around mid-April, I said I thought we were short-term overbought. The S&P went sideways for about a week or so, and that was that; it was off to the races. We’ll call that bullish for the S&P.
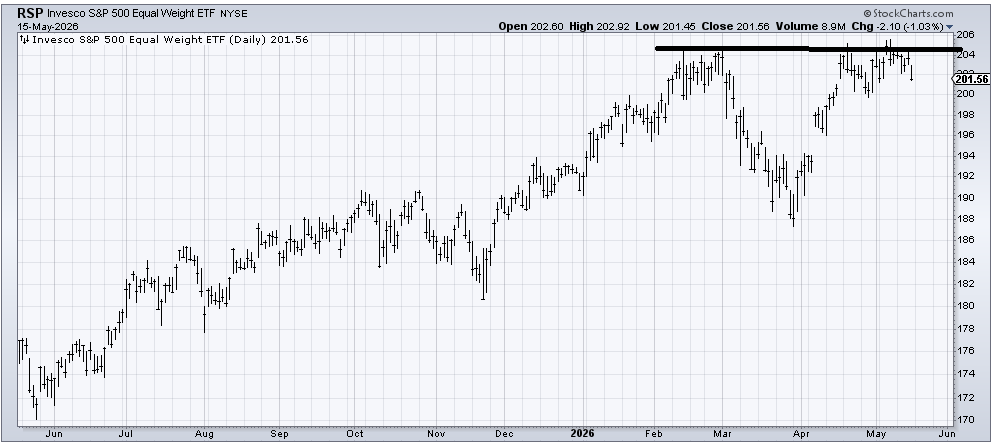
Now, let’s look at what the average stock was doing using the RSP, the equal-weight S&P. You can see the mid-April peak (which I would point out barely eclipsed the late February high; in fact, it basically matched it, but that was all). We had an overbought correction for a week or so, and then we lifted again.
I had thought we could lift into mid-May, but we lasted one week into May before it headed down again. And once again, it was a failure to get through resistance. We’ll call that bearish.
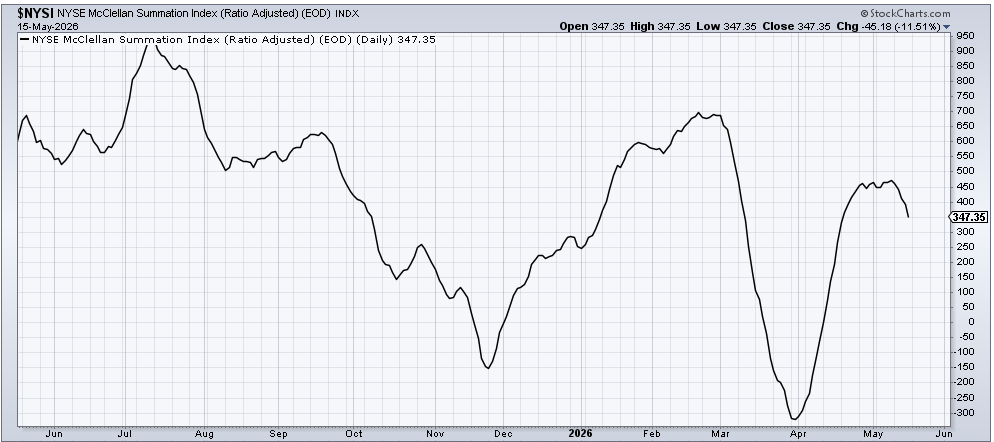
That means we had negative divergences. It starts with fewer stocks making new highs. It picks up when the new lows increase. It is also evident in the breadth charts I have been showing you, where breadth barely made a higher high and was trailing the S&P. Obviously, breadth is a bit more sensitive with the daily changes. So I smooth it out using the McClellan Summation Index, which stalled out in mid to late April and then rolled over last week.
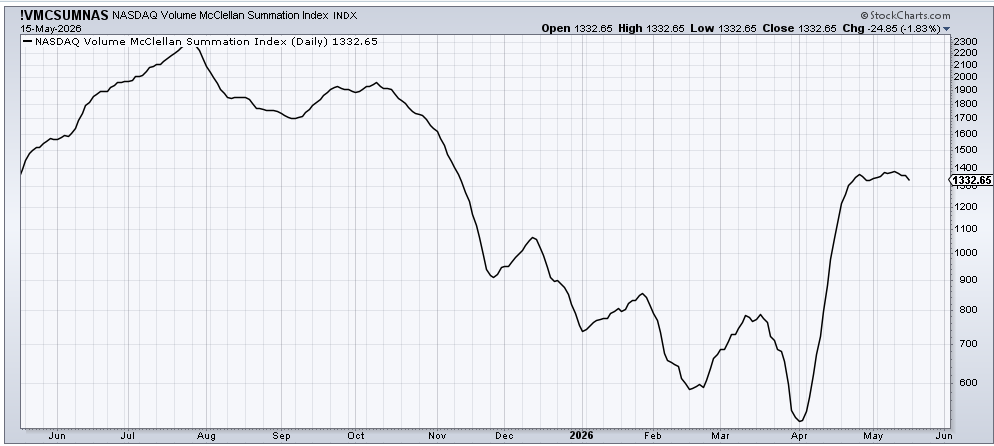
Lest you think it’s just the NYSE that’s lagging and Nasdaq is having all the fun, let me show you that the Nasdaq McClellan Summation Index has also begun rolling over. It peaked in late April.
In the very near term, Friday’s decline did not see a pick-up in stocks making new lows (vs Wednesday’s big reading). That’s the good news: the selling in groups like the banks dried up and moved over to tech stocks and metals, etc.
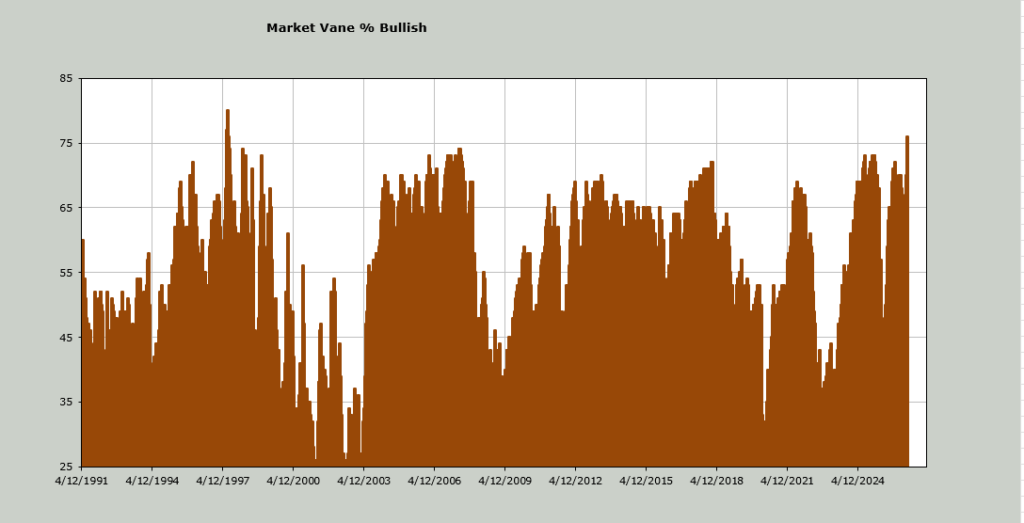
Sentiment, using the options ratios, got giddy. Using many other indicators, it did not; it just got complacent. But this weekend I saw that the Market Vane Bulls, an indicator I rarely discuss because it rarely gets too high or too low, got so high at 76%, I feel it is important.
It has not been this high since mid-year 1997. Before you get exuberant and think 1997 was awesome and then we still had two or three more years of upside, let me point out that the S&P spent the ensuing four months trading up and down in a ten percent range and culminated with a three day ten percent whack in October that brought about so much panic that even Abby Joseph Cohen, then the Chief Strategist at Goldman Sachs, who was known as a perma bull, turned cautious. See my note above that I think, at best, it’s a slog from here, and more likely we should expect more volatility.
New Ideas
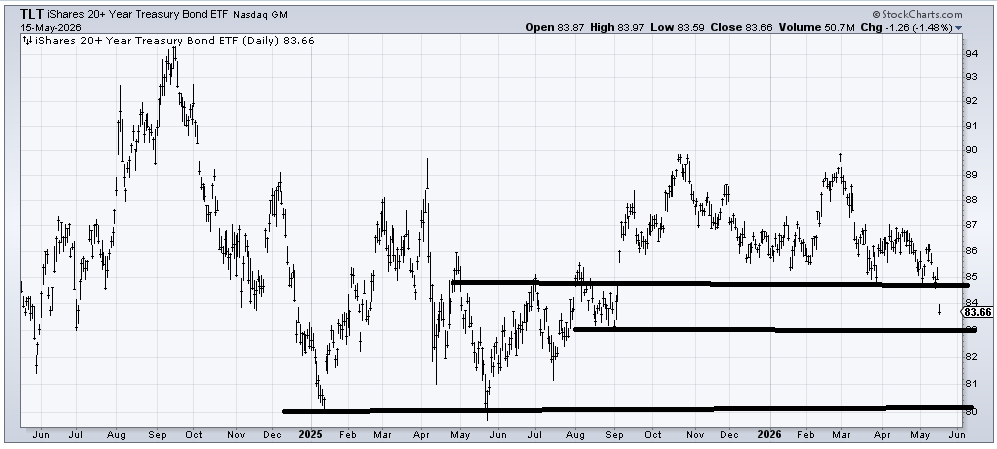
Let’s talk about TLT and interest rates. We finally got the push down in TLT into that 83-84 area. It feels too soon to like the bonds, but that push has gotten everyone talking (negatively) about bonds. That in turn has taken the DSI for bonds down to 22. Let’s see if we can get this reading low enough and therefore folks negative enough on interest rates to get a decent rally in bonds. That’s my focus in the next few weeks.
Today’s Indicator.
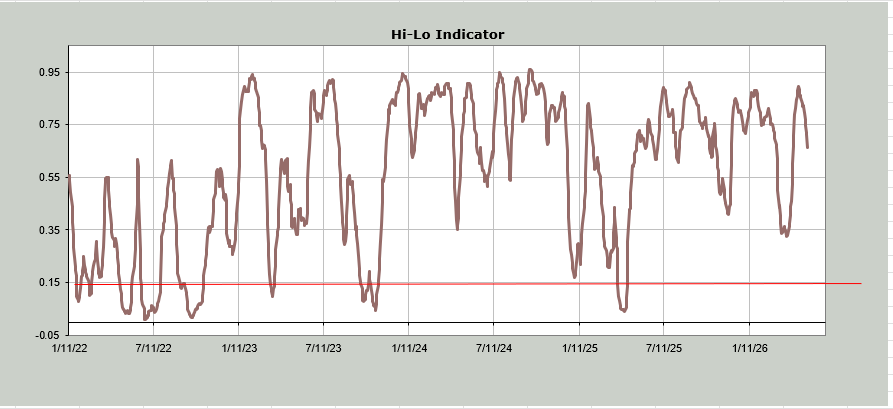
The NYSE Hi-Lo Indicator rolled over a few weeks ago. It gets oversold under .15. It is currently .67. Note that, unlike Nasdaq’s Hi-Lo Indicator, this did not get fully oversold in March.
Q&A/Reader’s Feedback
Helene welcomes your questions about Top Stocks and her charting strategy and techniques. Please send an email directly to Helene with your questions. However, please remember that TheStreet.com Top Stocks is not intended to provide personalized investment advice. Email Helene here.
I want to make a point that I made a week or so ago. When the market is heading into an intermediate-term oversold condition, I am more willing to give charts that are down and out the benefit of the doubt to be making a decent low. But that is not the case, having just reached an intermediate-term overbought condition.
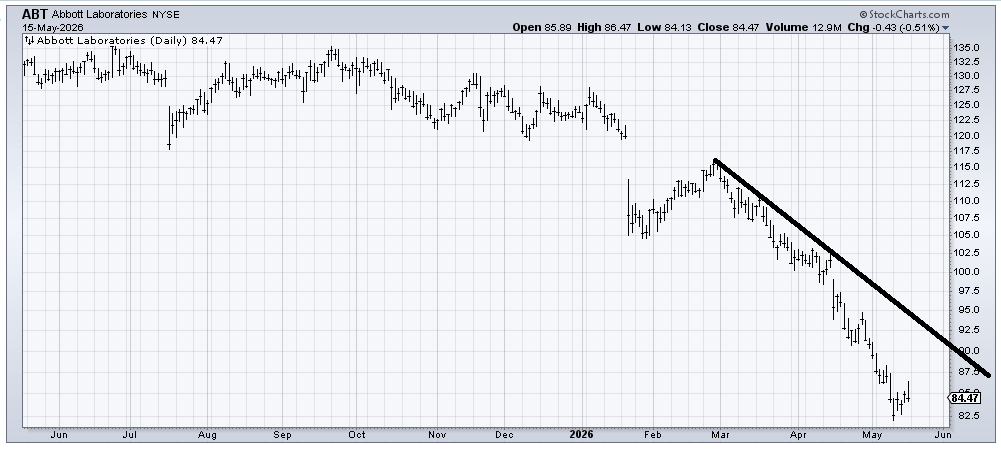
Once again, I have been asked about Abbott Labs (ABT). I cannot tell you how much I want to like this stock because I love to catch a falling knife, but I will tell you this: I was quite surprised to see ABT only yields 3%. That’s less than Treasuries! That having been said, the stock is quite oversold, so it ought to have some sort of rally, at least to the downtrend line, which is currently at 90 but goes lower over time. But right now, that is the best I can say.
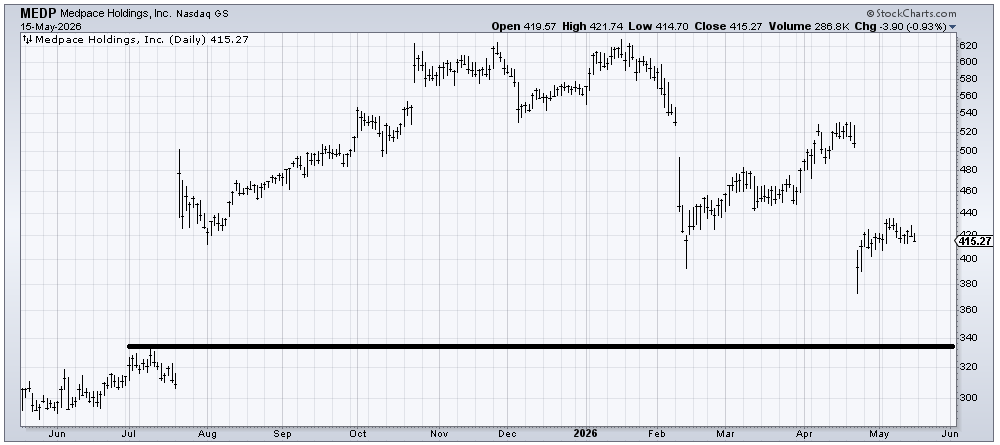
The best thing Medpace (MEDP) can do is retest that spike low (around 380) or fill the gap (around 340). Either one would have me interested in a trade for a rally. I would point out that it has been heading down for two weeks now, and if you squint, you can see that Friday’s selling did not (yet) take out the lows from earlier in the week, which is what I meant when I discussed how the selling in what had been down dried up Friday and it moved to tech.
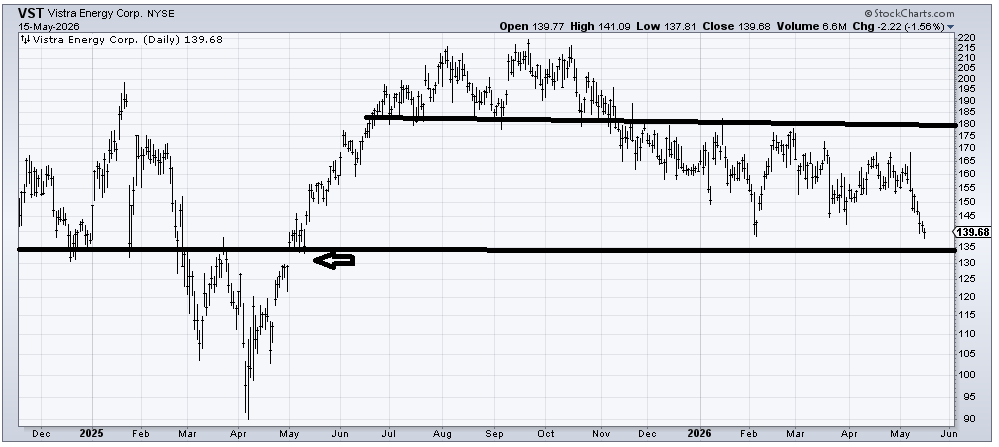
Vistra Energy (VST) has a measured target in this 130-140 area, and you can see that gap at 130. It’s oversold in the near term, but that’s the best I can say right now. I would love to see a small bounce and then a plunge toward 130 because it would feel less droopy and more panicky. Sort of the way it did in late January/early February. However, once again, note how many stocks peaked in mid-April; they had their oversold rally from March and came down again.
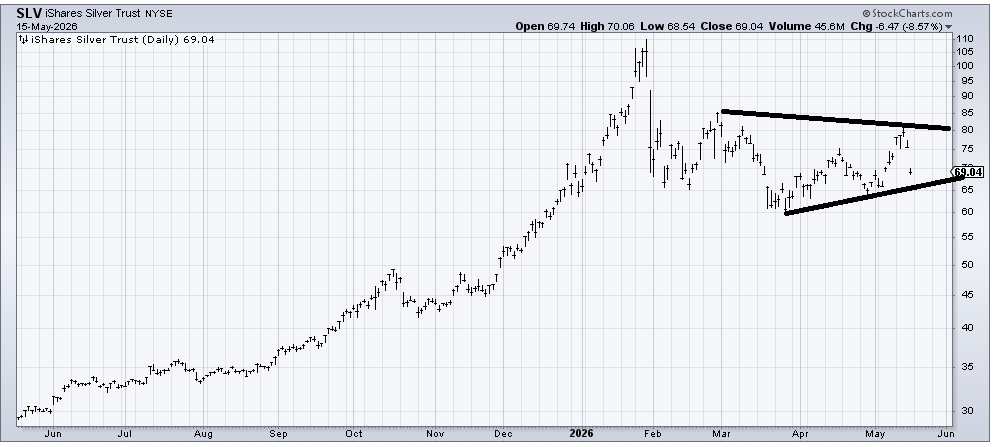
I am still not a fan of SLV, an ETF to be long silver. I know everyone got excited last week when it rallied, but it looks to me as if it remains in a range. I have drawn in an uptrend line that comes in around 65-66, so maybe we get a bounce off that, but that’s the best I see for now.
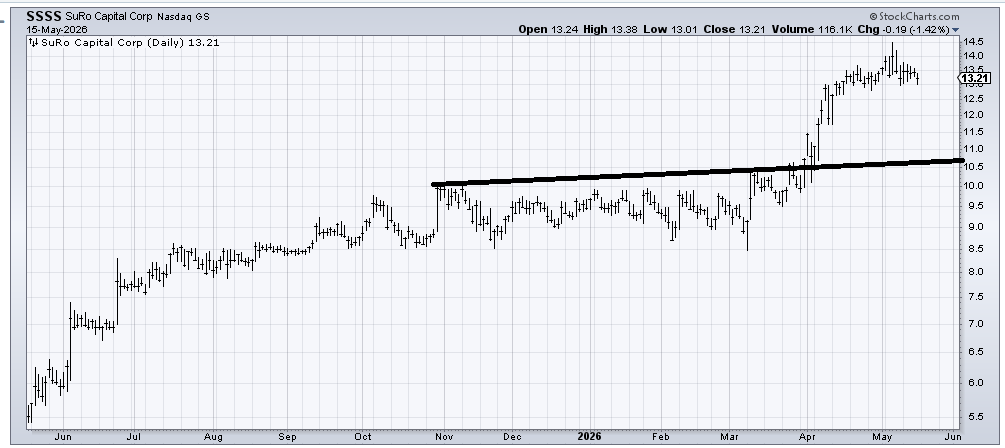
SuRo Capital (SSSS) just had a terrific run, and in an overbought market, I think it becomes vulnerable to profit-taking, especially if it starts to break under 12.75. I might want to take a little bit off the table here, just because the stock is up 30% in a few weeks, but otherwise, I get concerned if it starts to crack under that 12.75 area.
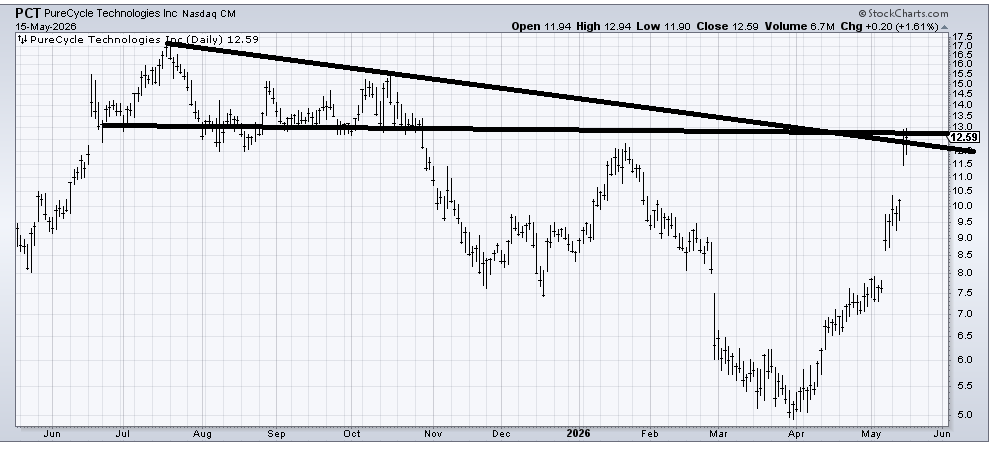
Pure Cycle (PCT) is a lovely chart that I wish would come back toward 10, fill the gap, and flesh out the right shoulder of a head and shoulders bottom.
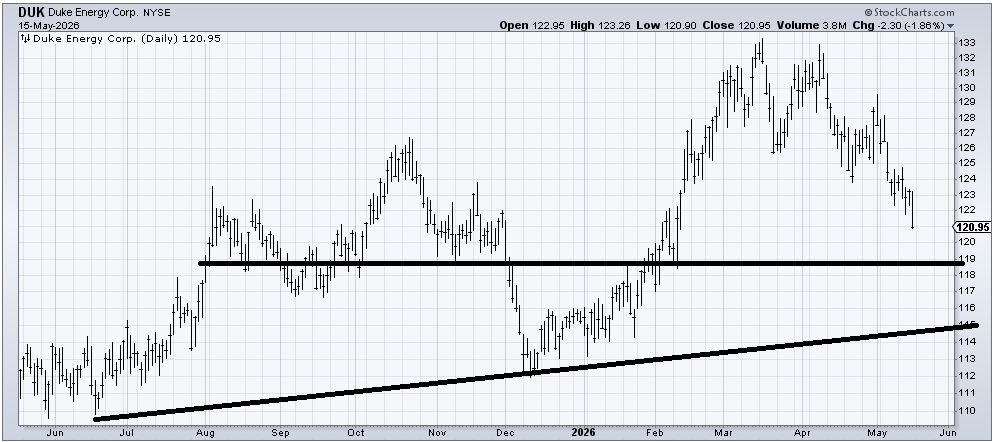
I said last week I think the Utes get interesting in this area. I often leave the specific stock to your discretion (my favorite is Southern (SO). Duke (DUK) measures into that 119 area with an outside shot at 115, so if it comes down into the 119 area, especially if the bond DSI gets low enough at that time, I’d start nibbling.
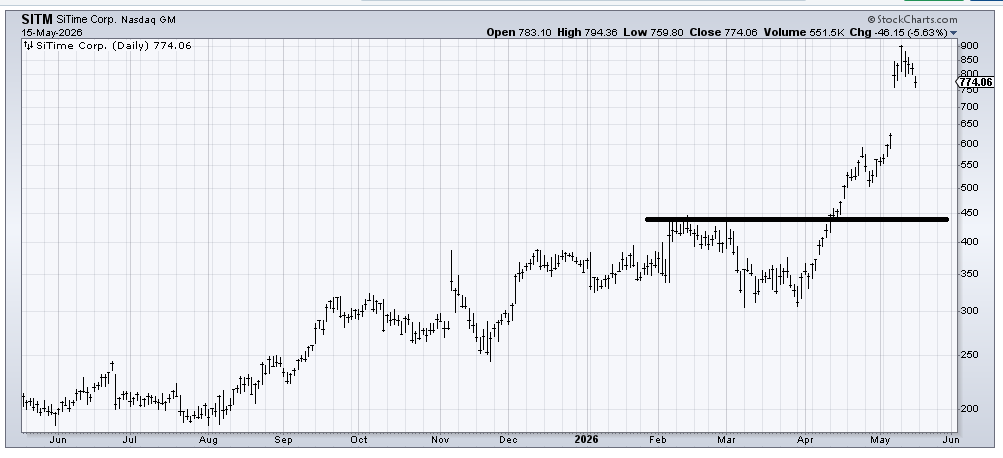
SiTime (SITM) has doubled in a month, so there is no way I am going to like that chart. But I can tell you if it gaps down from up here, it is going to leave the last week or so as an island (bearish). A more gradual filling of the gap is not bearish the way an island is.
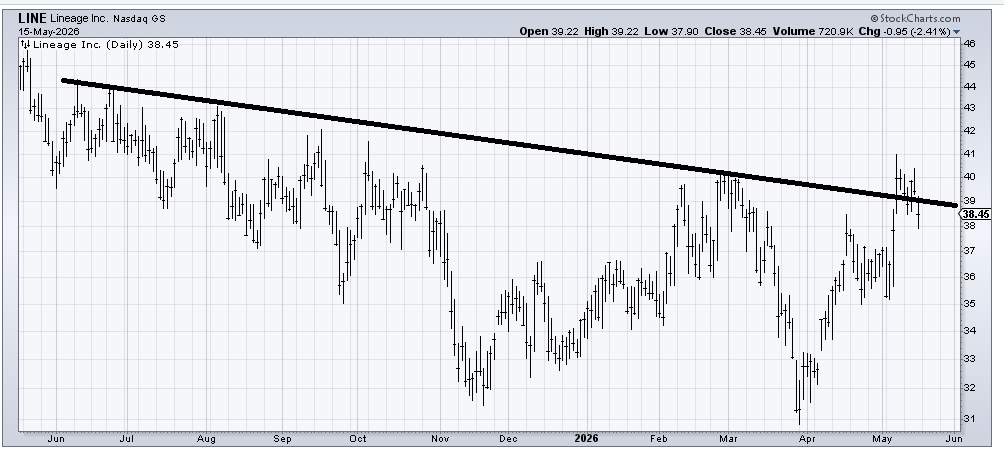
I am not fond of the way Lineage (LINE) had that false breakout over 39 last week. But I am inclined to think it is building a base of sorts. It does not have clear levels to my eye, but it appears to me that more time sideways is needed to get that left side of the chart to drop off and become less resistance because the stock is eating through the resistance. If the stock comes back into the 36-ish area, I would want to look at it again. Do remind me to look at it should it come back down there.
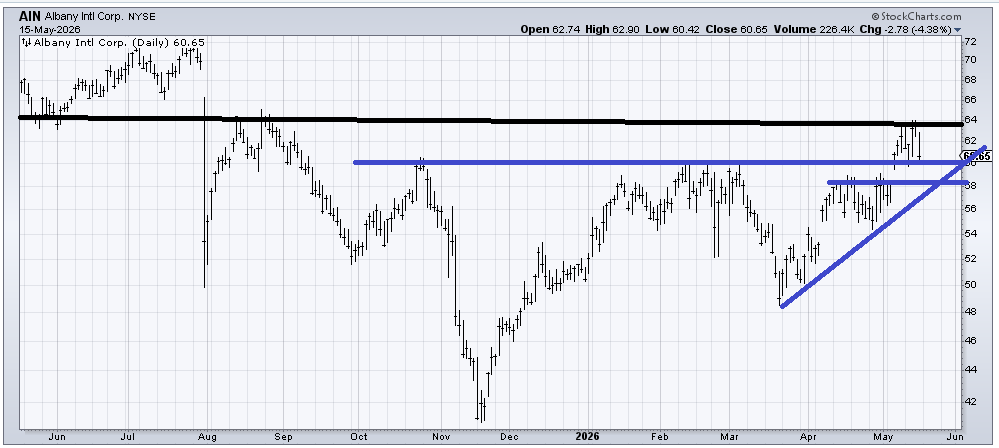
I see a chart like Albany International (AIN), and I see a base in the making. I would love to see it gradually make its way into that 58-60 area (blue lines). Gradually is better because it uses up time, which gets the market back toward an oversold condition (see the note at the top of this section).