Does Our Time Rhyme With 1999 or 1969?
We look back to the 1970s and find that the Magnificent 7 has some qualities of the Nifty 50.
You've reached your free article limit
You've read 0 of 1 free Pro articles.
I spent the day Tuesday reading about the early 1970s markets.
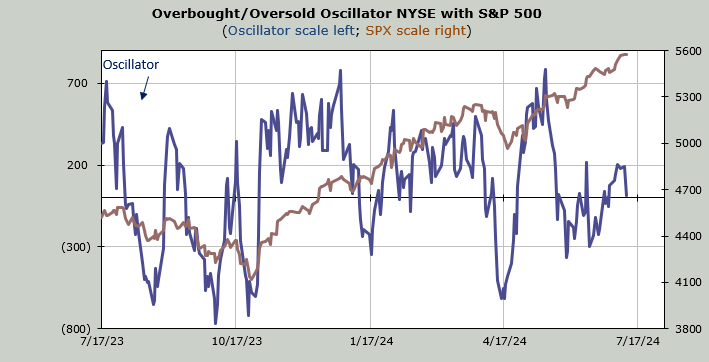
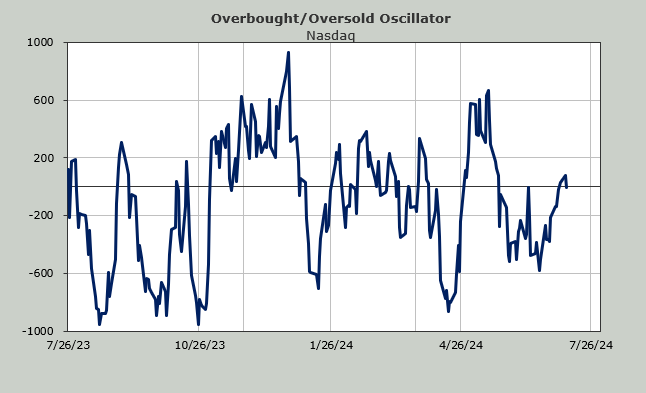
I know it is fashionable these days to think our current market is similar to the late 1990s. Who could blame you with the divergences, and so many of them showing that we haven’t seen such a divergence since 1999. But I don’t believe this market is like 1999.
In 1999 the trading was wild. There were new IPOs almost daily. And those IPOs soared on the first day of trading. And the day after that, and the week after that. They were doubling, tripling. We have seen none of that in this market.
While I’m not sure this is exactly like the early 1970s either, there are several similarities. In 1968 we had a peak in the market. Speculation was running amok. I would liken it to early 2021 with SPAC-mania. The market corrected, (I believe they called it a bear market then) into 1970 and made a low. It was after that 1970 low that the Nifty Fifty emerged.
I relied on Walter Deemer’s excellent notes from that period. He reminds us that they weren’t even called the Nifty Fifty at the time, and no one really kept a list. I thought of that because the Magnificent 7 has gone from seven stocks you could name to the Mag 4, the Mag 6, or maybe the Mag 10. In other words, it’s a moving target.
The one thing folks agree on is that there are a handful of stocks that the market views as names that can do no wrong. They are names that are ‘one decision’ stocks, the only decision being, when do I buy the stock (again)?
The best example is Meta META , which disappointed when earnings were reported last quarter but was quickly snapped up and now resides right back at the highs.
In any event I want to share with you what I learned. There were mutual funds that owned the list of ‘glamour’ stocks. Some companies had a few funds, a Glamour Fund and maybe a Consumer Glamour Fund. I read the lists of the names that were in them. There was some crossover. For example, Avon was in both.
If that sounds familiar, that’s because we have ETFs now and whether they are tech or not, they probably have Apple AAPL in them. Or they have found a way to make Nvidia NVDA or Netflix NFLX a stock that is a member. The more money that poured into the glamour funds, the higher they went. It’s not much different than today.
What struck me as I read through Walter’s notes was how each month he would list the ‘attractive groups’ in the market and the ‘unattractive groups’ in the market. Over and over again, even as the major indexes rose the list of unattractive groups to attractive groups was more often than not around five to one. That’s quite a ratio, isn’t it?
And it sounds familiar to today’s market with so many stocks just languishing, so many down and out stocks that you think must be sold out and yet they manage to gap down and unlike Meta, they do not get bought immediately.
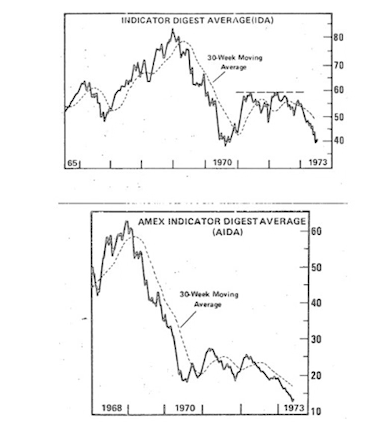
Here are two charts I found that he posted. They are from Indicator Digest. Without getting too technical, think of them as the chart of breadth with the top being the NYSE and the bottom being the Amex (keep in mind Nasdaq was just getting started in the early 70s so the Amex was the speculative exchange). See the peak in 1968? Then the low in 1970 that had a half hearted rally back to the highs.
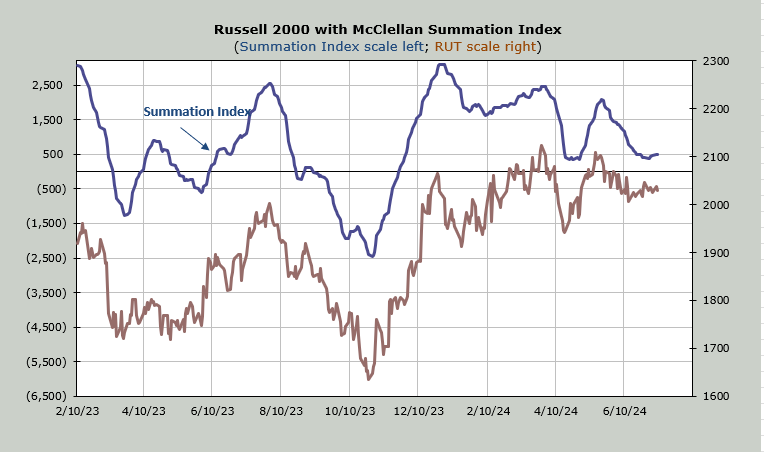
It’s not much different than the McClellan Summation Index, a breadth indicator, that has been heading down since December, with lower highs. And now can’t even turn up even though it tried to earlier in the week.
No matter what we call this elite group of stocks that get all the love, the psychology is the same: no one wants to bother with stocks outside the favored few.