Correction? For Now It's All Just Chatter
How panicky did the selling get Tuesday? Let's scare up the numbers. Plus, we check the levels to watch for the Nasdaq, semis, S&P and small-caps, as well as commodity sentiment.
You've reached your free article limit
You've read 0 of 1 free Pro articles.
Did anyone get scared? Did anyone get panicky? Not that I saw.
What I saw was Monday’s chatter about the market broadening out morphed into correction chatter. But who can argue against them? We do need a proper correction, don’t we?
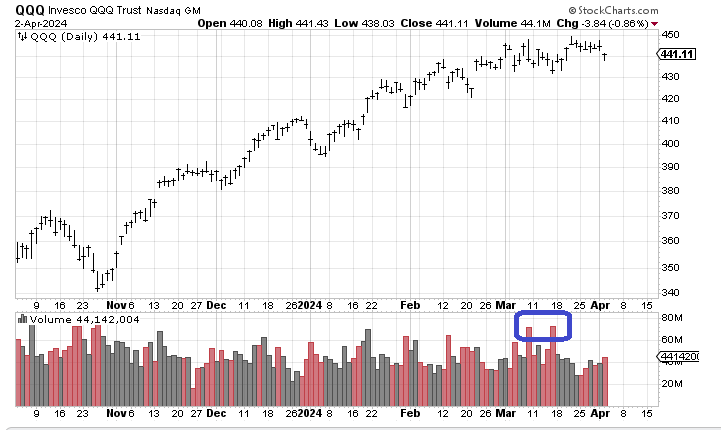
Let me start with the premise that there was no panic during Tuesday’s decline. In panicky declines we tend to see volume rise. Long-time readers know that I will tend to use the QQQ volume as a guide to how panicky selling was. Tuesday’s decline saw 44 million shares trade in the QQQs.
Just last month, in March, we had two big down days (circled on the chart, below) and you can see volume clocked in at around 75 million shares. So why were folks panicky a month ago but not now? Could it be there is still complacency out there?
Or can it be that the lines held? And unless/until those uptrend lines get broken no one is going to panic. A month ago the lines weren’t so obvious and now they are so perhaps that’s it.
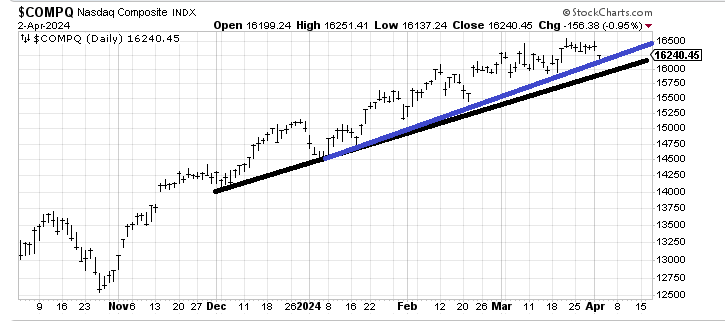
Check out the Nasdaq’s chart. The black line dates to December and we didn’t come close to it on Tuesday. The blue line is right here. I think 16,000, which was support throughout March, is where the black line comes in and therefore is the level that would scare folks if broken.
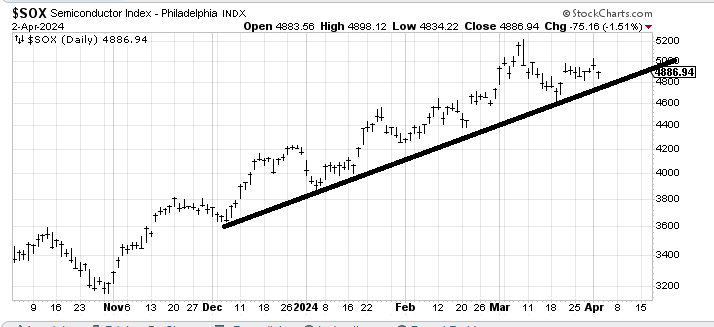
The SOX (Philadelphia Semiconductor Index) has held that 4800 area too. In fact it was down there late last week and again on Tuesday. It is now also where the line comes in. For me that solidifies that level as important.
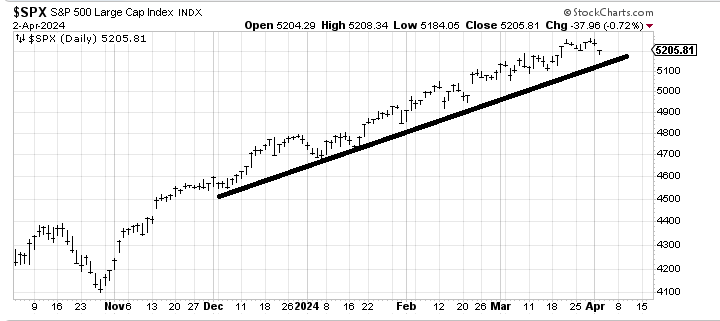
The S&P’s line began the week at 5100 and now resides closer to 5120 so we didn’t even come close to it.
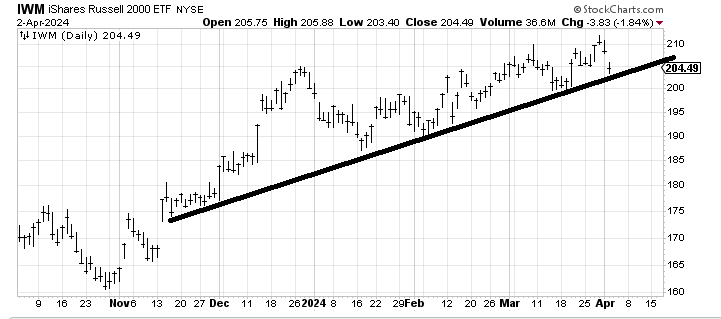
The Russell 2000 IWM, finds itself right back at the line too.
We are not yet oversold but the selling did dry up about an hour or so into the trading session. If the market can come down more over the next few days the short-term Overbought/Oversold Oscillator will finally move back to an oversold condition for the first time in months.
I would also note that despite the move in interest rates, the 10-Year Treasury still did not get over 4.35% as the selling dried up there as well.
Let me end by noting that we can feel the love for commodities, but shockingly to me the Daily Sentiment Index (DSI) for gold did not budge on Tuesday; it remains at 88. Silver’s DSI, thanks to the surge upward on Tuesday, jumped from 81 to 88. And crude oil's pushed to 84.
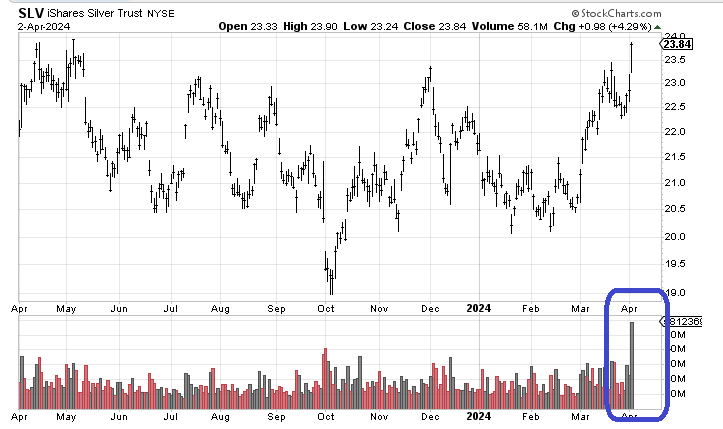
The precious metals are in yellow-flashing-light territory (over 90 is red flashing lights). And oil is on the verge. The CRB Index’s DSI is at 85. So everything is knocking on the door. And if you want to see panic, look at the volume in the iShares Silver Trust SLV. Looks like folks panicked to get in.
For my take on FedEx FDX, CME Group CME, Visa V and much more check out the latest edition of Top Stocks.
