Can the S&P 500 and Nasdaq 100 Keep Climbing? You Bet
After amazing rallies, let's chart out some new targets.
You've reached your free article limit
You've read 0 of 1 free Pro articles.
There is only one way to interpret the weekly chart of the S&P 500: relentlessly bullish. Let’s zoom out to get a picture of what has already happened, and use that to see where this market is headed next - for both the S&P 500 and the Nasdaq 100.
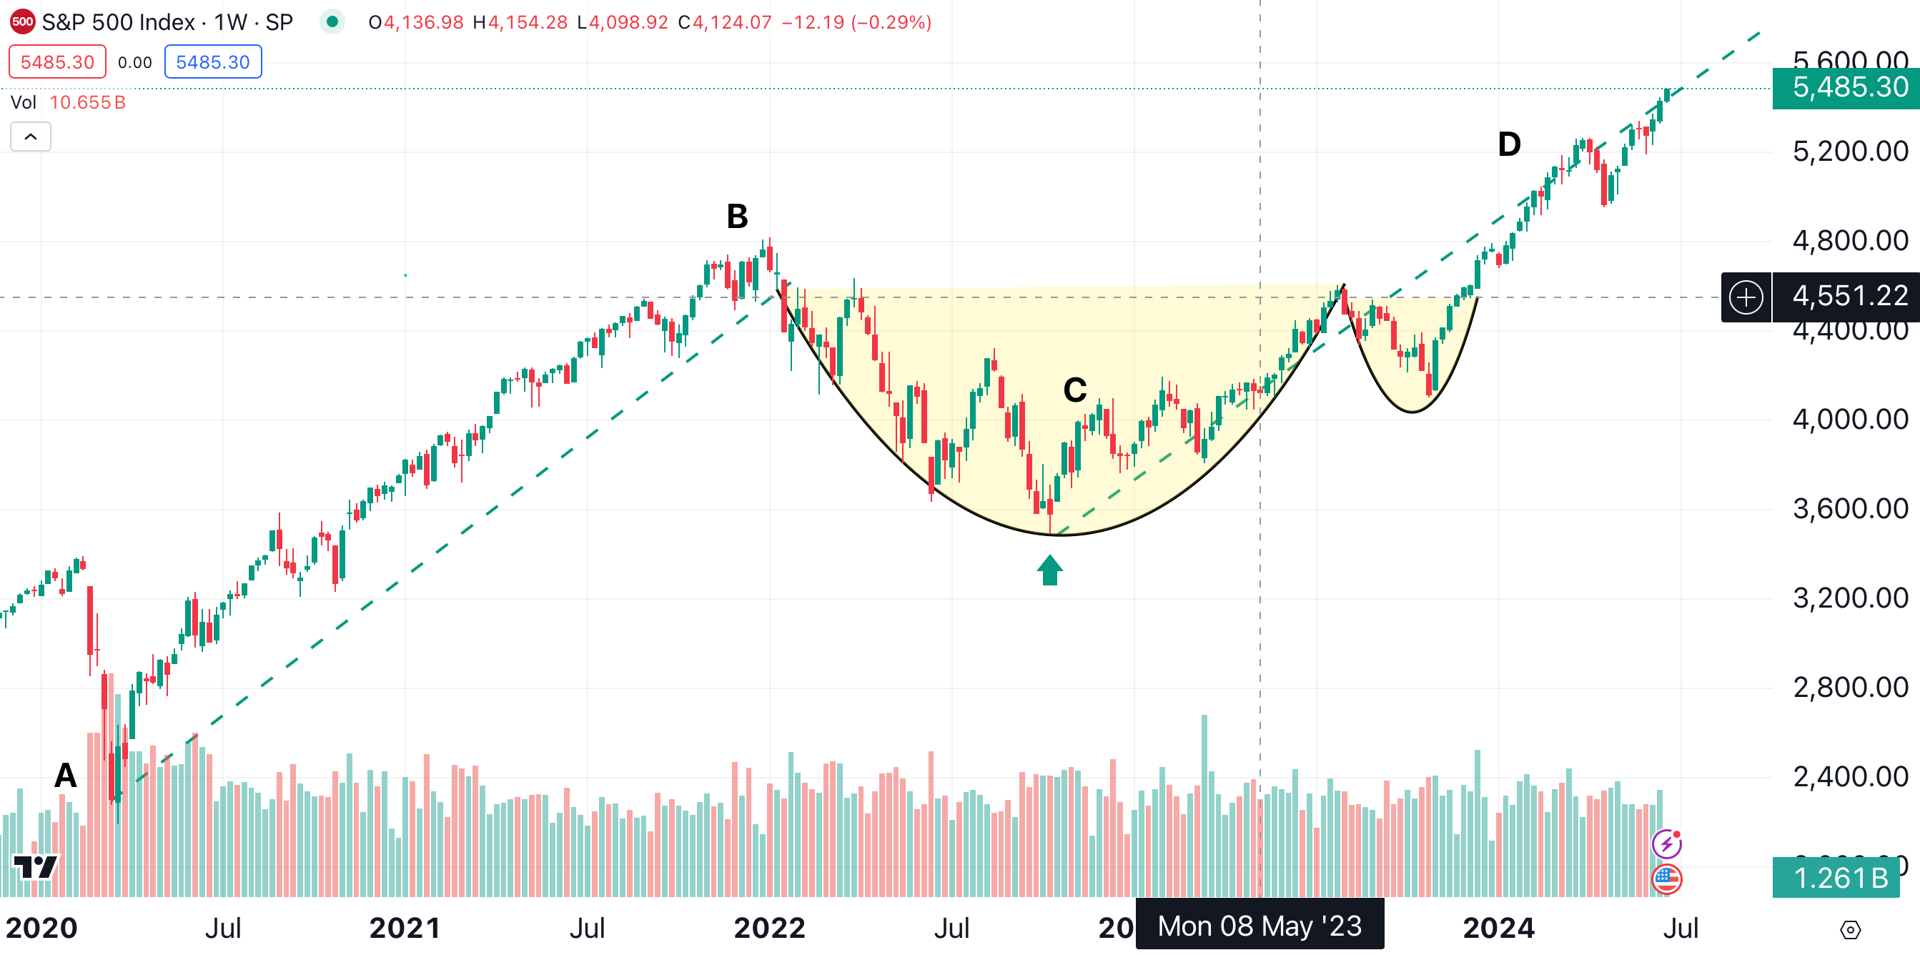
A massive rally started in the early days of the pandemic, in March of 2020 (point A). By January of 2022, the S&P 500 had more than doubled (point B).
This was followed by a massive cup and handle (point C, shaded yellow). This bullish consolidation pattern lasted nearly two years. Ideally, a cup-and-handle pattern is formed over just two months.
The S&P 500 broke out of that pattern in December 2023, and has been rising ever since (point D).
Back in February, with the S&P 500 trading just below 5000, we used an A-B-C-D pattern to create a target of 5400. That target seemed aggressive at the time, but now it needs to be updated.
Let’s create a new target using a variation of the technique that we used to create the prior target. This time, we’ll incorporate the cup-and-handle pattern - specifically, the low point of that pattern - into the equation.
The rally from point A to point B was roughly 2,500 points. The low point of point C is just below 3,500 (arrow). Add A-B (2,500) to C (3,500) and you have a new preliminary target of 6000.
Now let’s adjust that target slightly lower, since there are probably other traders who are generating that 6000 target using a similar technique. We'll shoot for an area just below them. We’ll place our target slightly lower, at 5975.
The Nasdaq 100 has a very similar chart, so we can apply that technique once again.
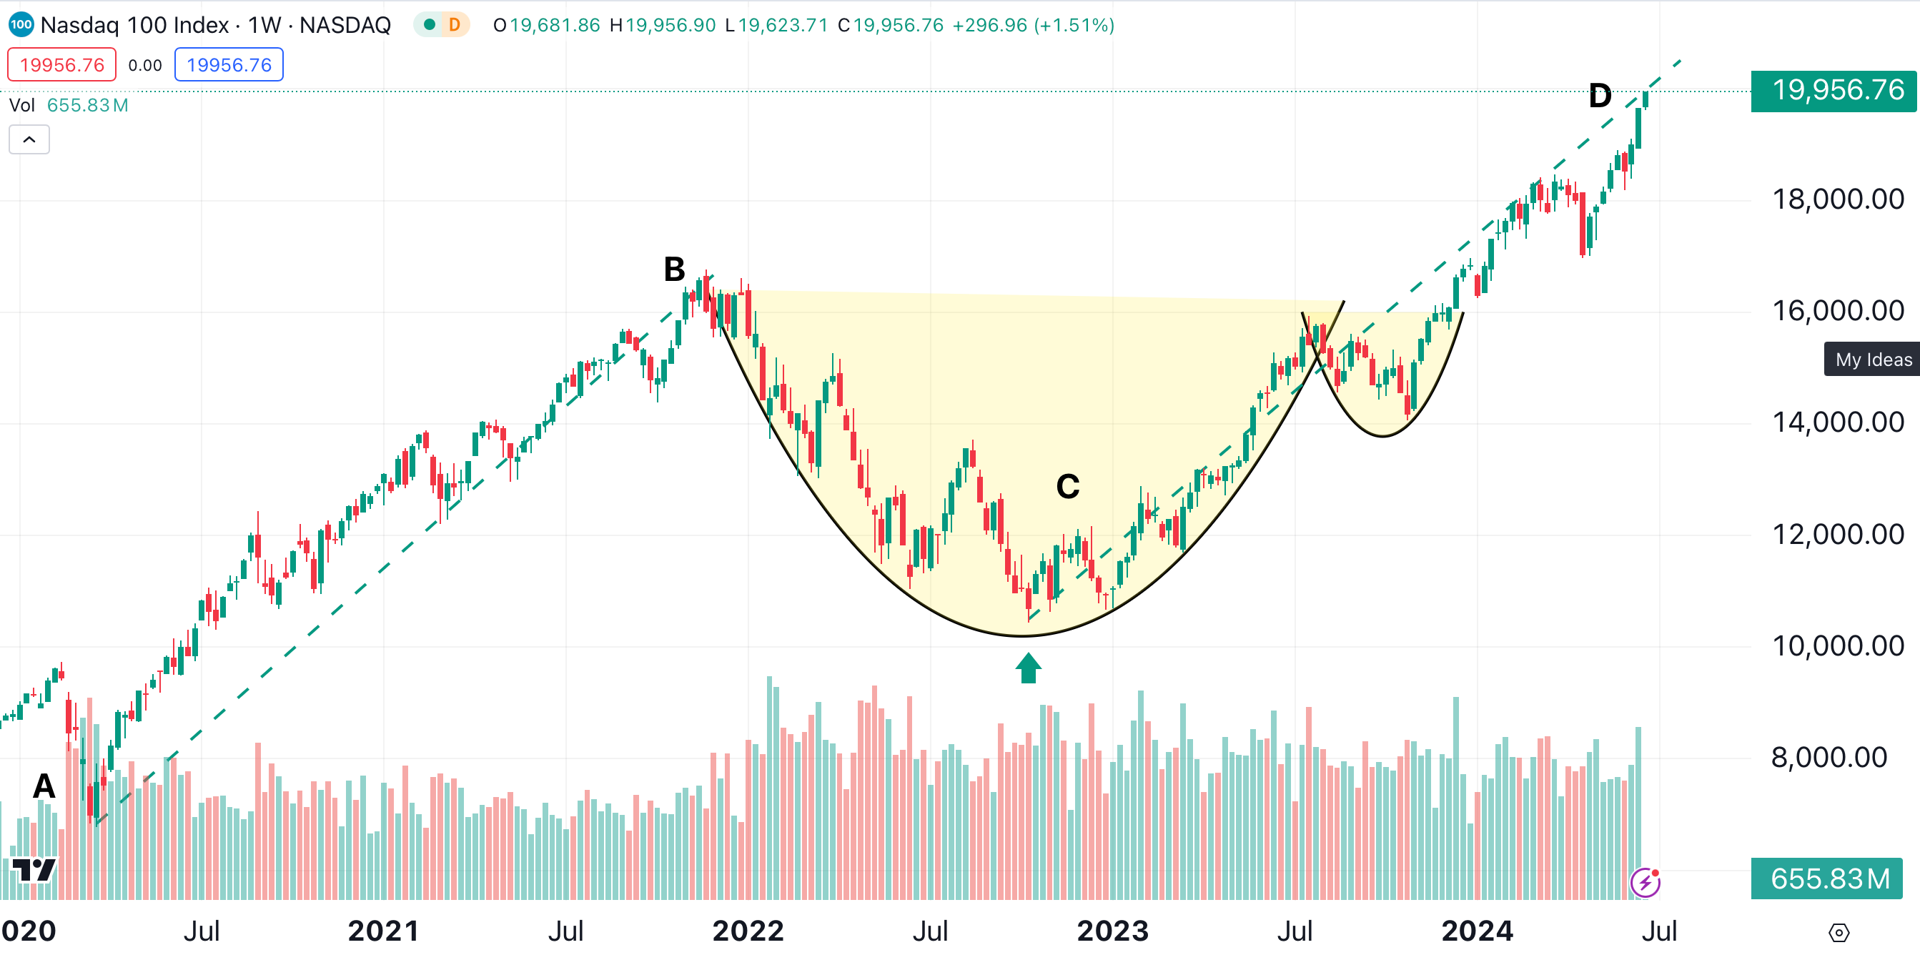
In this case, the distance from point A to point B is approximately 10,000 points. A cup-and-handle pattern also appears on this chart (shaded yellow).
The low point of the cup and handle is about 10,500 (arrow). Add 10,000 to 10,500 and your new target for the Nasdaq 100 is 20,500 (point D).
While it could take weeks to reach our new target for the S&P 500, our new Nasdaq target really isn’t far. We could reach it soon, but I'm not going to just pull a higher number out of thin air.
It’s like my mentor told me, take what the market gives you, and try not to be greedy. If 20,500 is what the market is willing to give, I’ll take it.
At the time of publication, Ponsi had no position in any security mentioned.