For the S&P and Dow, the Best Is Yet to Come
Heavy involvement by retail investors often precedes a crash -- but it doesn't necessarily happen right away.
You've reached your free article limit
You've read 0 of 1 free Pro articles.
Twenty-five years ago, on March 29, 1999, the Dow Jones Industrial Average hit 10,000 for the first time. Dow 10,000 hats were handed out on the floor of the New York Stock Exchange.
By 2003, the venerable index traded below 7,300. For a while, the Dow 10,000 hats became the punchline of many a joke. Now they are collectors items, going for about $165 on eBay EBAY .
Fast forward to Wednesday, and the Dow is trading at a record 38,700. The S&P 500 is also trading at an all-time high, touching an intraday peak of 4999.89. The 5000 milestone looms just ahead.
Will SPX 5000 mark a top? Not necessarily. Less than a year after breaching 10,000 for the first time, the Dow hit 11,600. That's a gain of 16% in less than a year.
Milestones like Dow 10,000 and SPX 5000 are important because they are widely reported. This in turn generates interest from retail investors. In 1999, the Dow 10,000 phenomenon eventually led to a parabolic move higher. That move was aided by long-only retail investors.
At this point, you may be thinking, "Ed, aren't retail investors frequently wrong?"
True. Heavy involvement by retail investors often precedes a crash -- but it doesn't necessarily happen right away.
In 1999, I was a trading desk newbie on Wall Street. Many of my more experienced colleagues correctly identified that stocks in general, and the Nasdaq in particular, was in a bubble.
They were proven correct -- eventually. If they got out too soon, they missed the best part. The Nasdaq Composite gained 85.6% in 1999, with many stocks doubling and tripling in value.
Imagine missing out -- not because you were wrong, but because you were right.
In 2024, the S&P 500 should also continue to reach new heights. Let's go to the charts to project a price target for the large-cap index, using an A-B-C-D pattern.
View Chart »View in New Window »
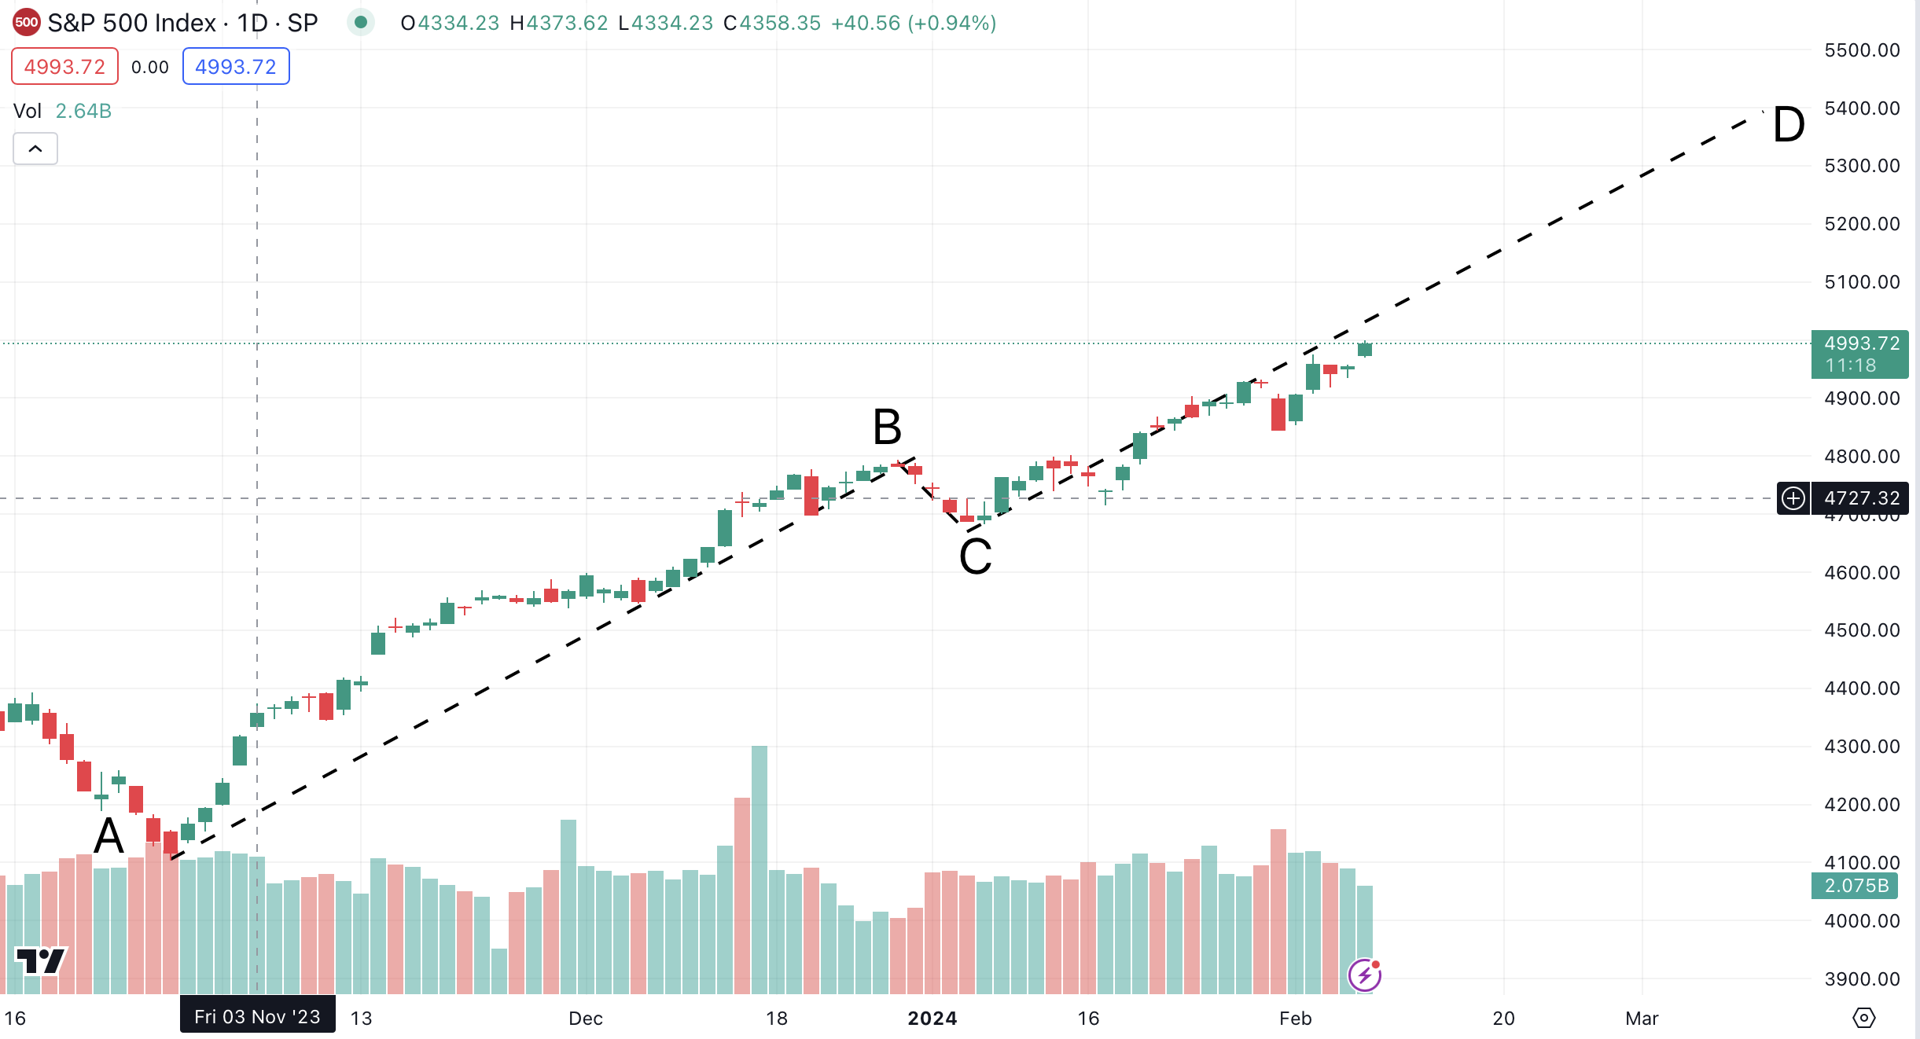
Chart via TradingView
The S&P 500 rally from point A to point B, which occurred from late October through late December 2023, was approximately 700 points (A-B). This was followed by a shallow pullback to 4682 (B-C).
To create a target, add 700 points to the 4682 low. The resulting target is 5382, which rounds up to 5400. That's about an 8% gain from Wednesday's close.
Goldman Sachs GS recently raised its 2024 target from 4700 to 5100. JPMorgan JPM set a target of 4200.
Their viewpoints make sense. Stocks had a great year in 2023, and interest rates are finally expected to weigh on the economy in 2024. This in turn should weigh on stocks.
However, the economy is not the market. They are two separate entities. The economy may be in question right now, but the major indexes are not.
At the time of publication, Ponsi had no positions in any securities mentioned.