Bonds Make a Big Move, But Stocks Are Still Ignoring Them
How do we get more fear into this market? First we need to change the pattern. And while bonds didn’t scare folks, at least the Utilities finally noticed. Here's what to look for this week.
You've reached your free article limit
You've read 0 of 1 free Pro articles.
I left for one day and you know what the market did? It kept that pattern alive of up/down/up down. That is now 10 straight days where the market has not had consecutive up or down days. That means that 5670 area of the S&P 500 hasn’t broken either.
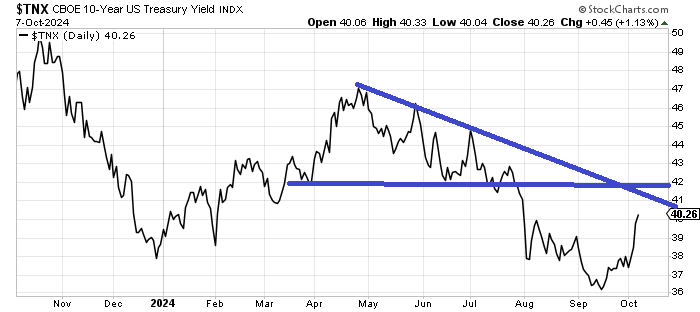
The biggest move came from the bonds. And boy have they moved. Thus far stocks have ignored the bonds, though. Yields have moved up quite a bit and I have my eye on this 4.10-4.20% area.
The best news for bonds is that everyone was talking about them on Monday so they are finally getting some attention, although no one sounded particularly bearish, just thinking they had gone too far. The Daily Sentiment Index (DSI) is 37. As a reminder, the DSI for bonds was near 90 in August so the pendulum is swinging back the other way now. I suspect we see a bounce in bonds (yields back off) the next few days.
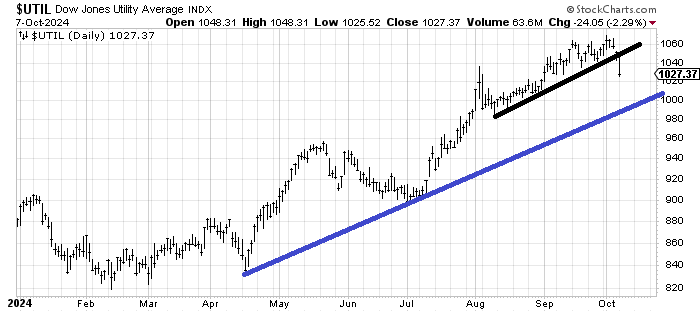
Then there are the Utes, which I have been railing against for weeks now (maybe longer). They finally noticed the bonds on Monday and broke that uptrend line that has been in place since August. This is also the first four-day losing streak for the Utes since early April so it really is a change. I am inclined to think it doesn’t happen all at once but the Utes ought to make it down to that blue line.
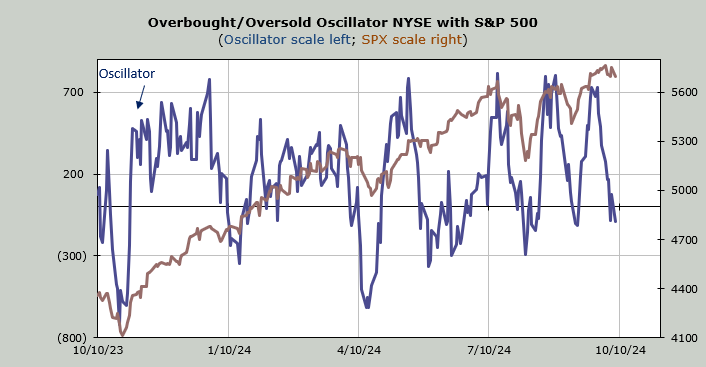
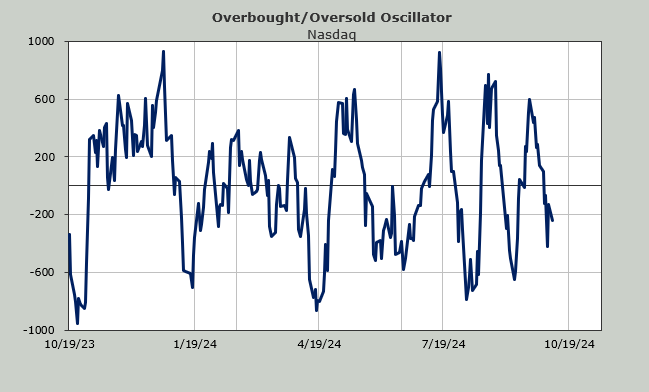
As for stocks, they didn’t seem to have much selling even though breadth was the worst it has been in a month. Before I left I noted that if we can get the market breadth red this week for a few days we can get to an oversold condition by the end of this week/early next week.
Remember "sell Rosh Hashanah so you can buy Yom Kippur." Rosh Hashanah was last week and Yom Kippur is this coming weekend. In any event, the math says a few more red breadth days and this will be oversold.
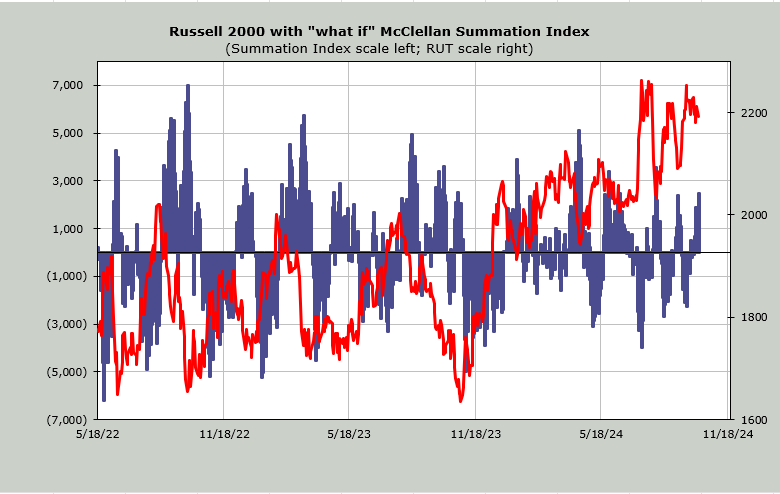
The McClellan Summation Index is heading down but here is the chart of the "what if" meaning what it will take to turn the Summation Index from the current down to up. Currently it would require a net differential of +2,500 advancers minus decliners on the NYSE.
That is the same amount we needed in early September but if you squint hard you can see typically we need more than +3,000. Once we get to +3,000 we are getting oversold. Here too you can see that if we get a few more negative breadth days this indicator will also be oversold.
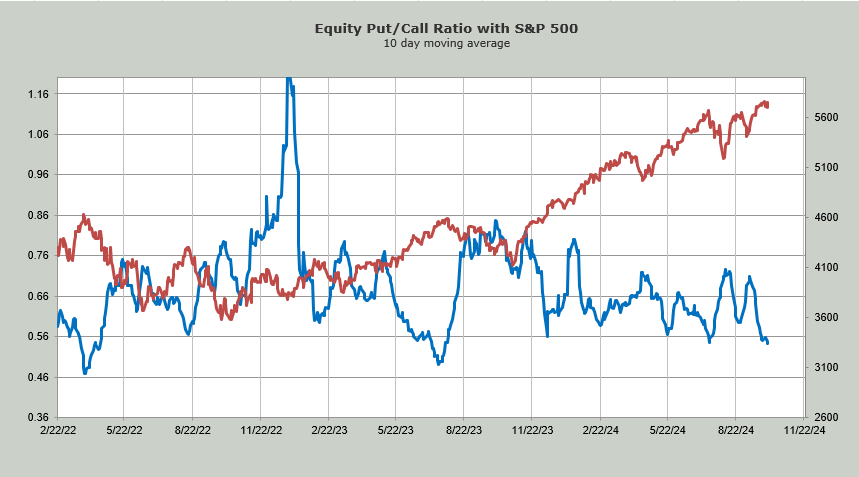
The intermediate-term indicators are not oversold but they are finally moving in that direction. The challenge I have is sentiment. The put/call ratio on Monday was 0.79, which is absurdly low for a down day. The 10-day moving average of the equity put/call ratio continues to fall and is now heading toward levels not seen in more than a year.
So bonds didn’t scare folks and so far neither have stocks. I have no idea if we’ll keep this every-other-day pattern going but if we change it and the market can stay red for a few more days I am pretty sure we’d get some more fear in the market by the end of the week.