As Powell Takes His Final Bow, Inflation Is Ready for Main Stage
While the Fed ponders its next move, charts show inflation ready to climb.
You've reached your free article limit
You've read 0 of 1 free Pro articles.
On Wednesday, Jerome Powell said goodbye.
Powell’s term as Federal Reserve Chair is coming to an end, and Wednesday’s Federal Open Market Committee meeting was the last with him at the helm.
Earlier on Wednesday, Kevin Warsh’s nomination to be Powell’s replacement advanced through the Senate Banking Committee, putting him on track to be sworn in before the Fed’s next meeting, scheduled for June 17.
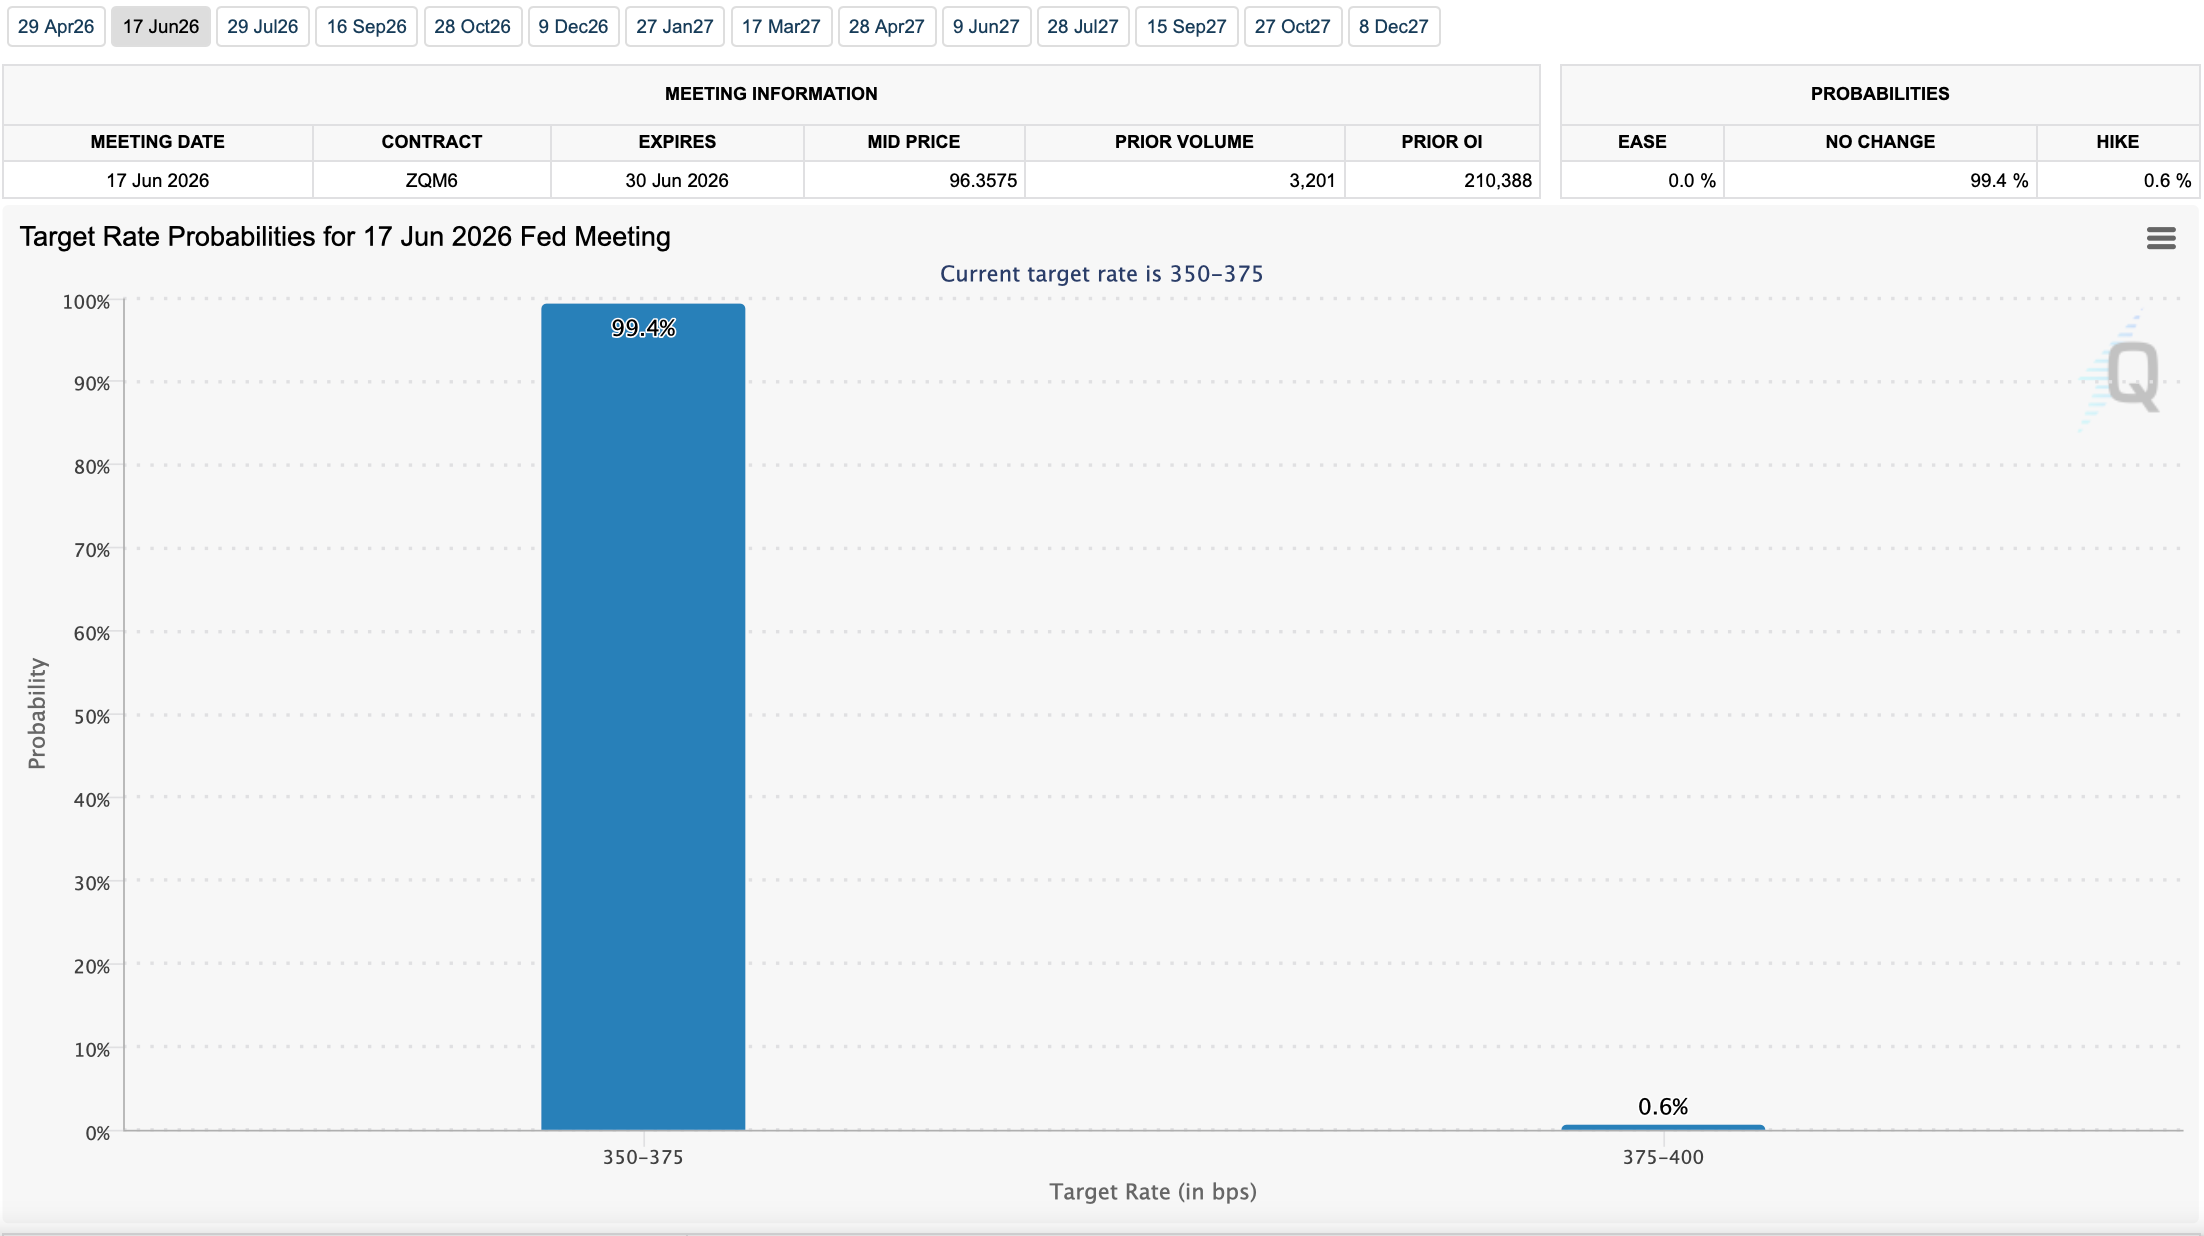
The market overwhelmingly believes that the FOMC will hold rates steady at that meeting. The CME Group’s FedWatch Tool currently indicates a 0% chance of a rate cut, and a less than 1% chance of a rate hike.
In an unexpected move, three members of the Fed’s decision-making body — Kashkari, Hammock and Logan — supported the decision to keep rates on hold, but objected to including an easing bias in the FOMC statement.
The Right Call
They’re correct. There shouldn’t be a Fed easing bias right now. Not while U.S. treasury yields are climbing sharply, a warning sign of future inflation.
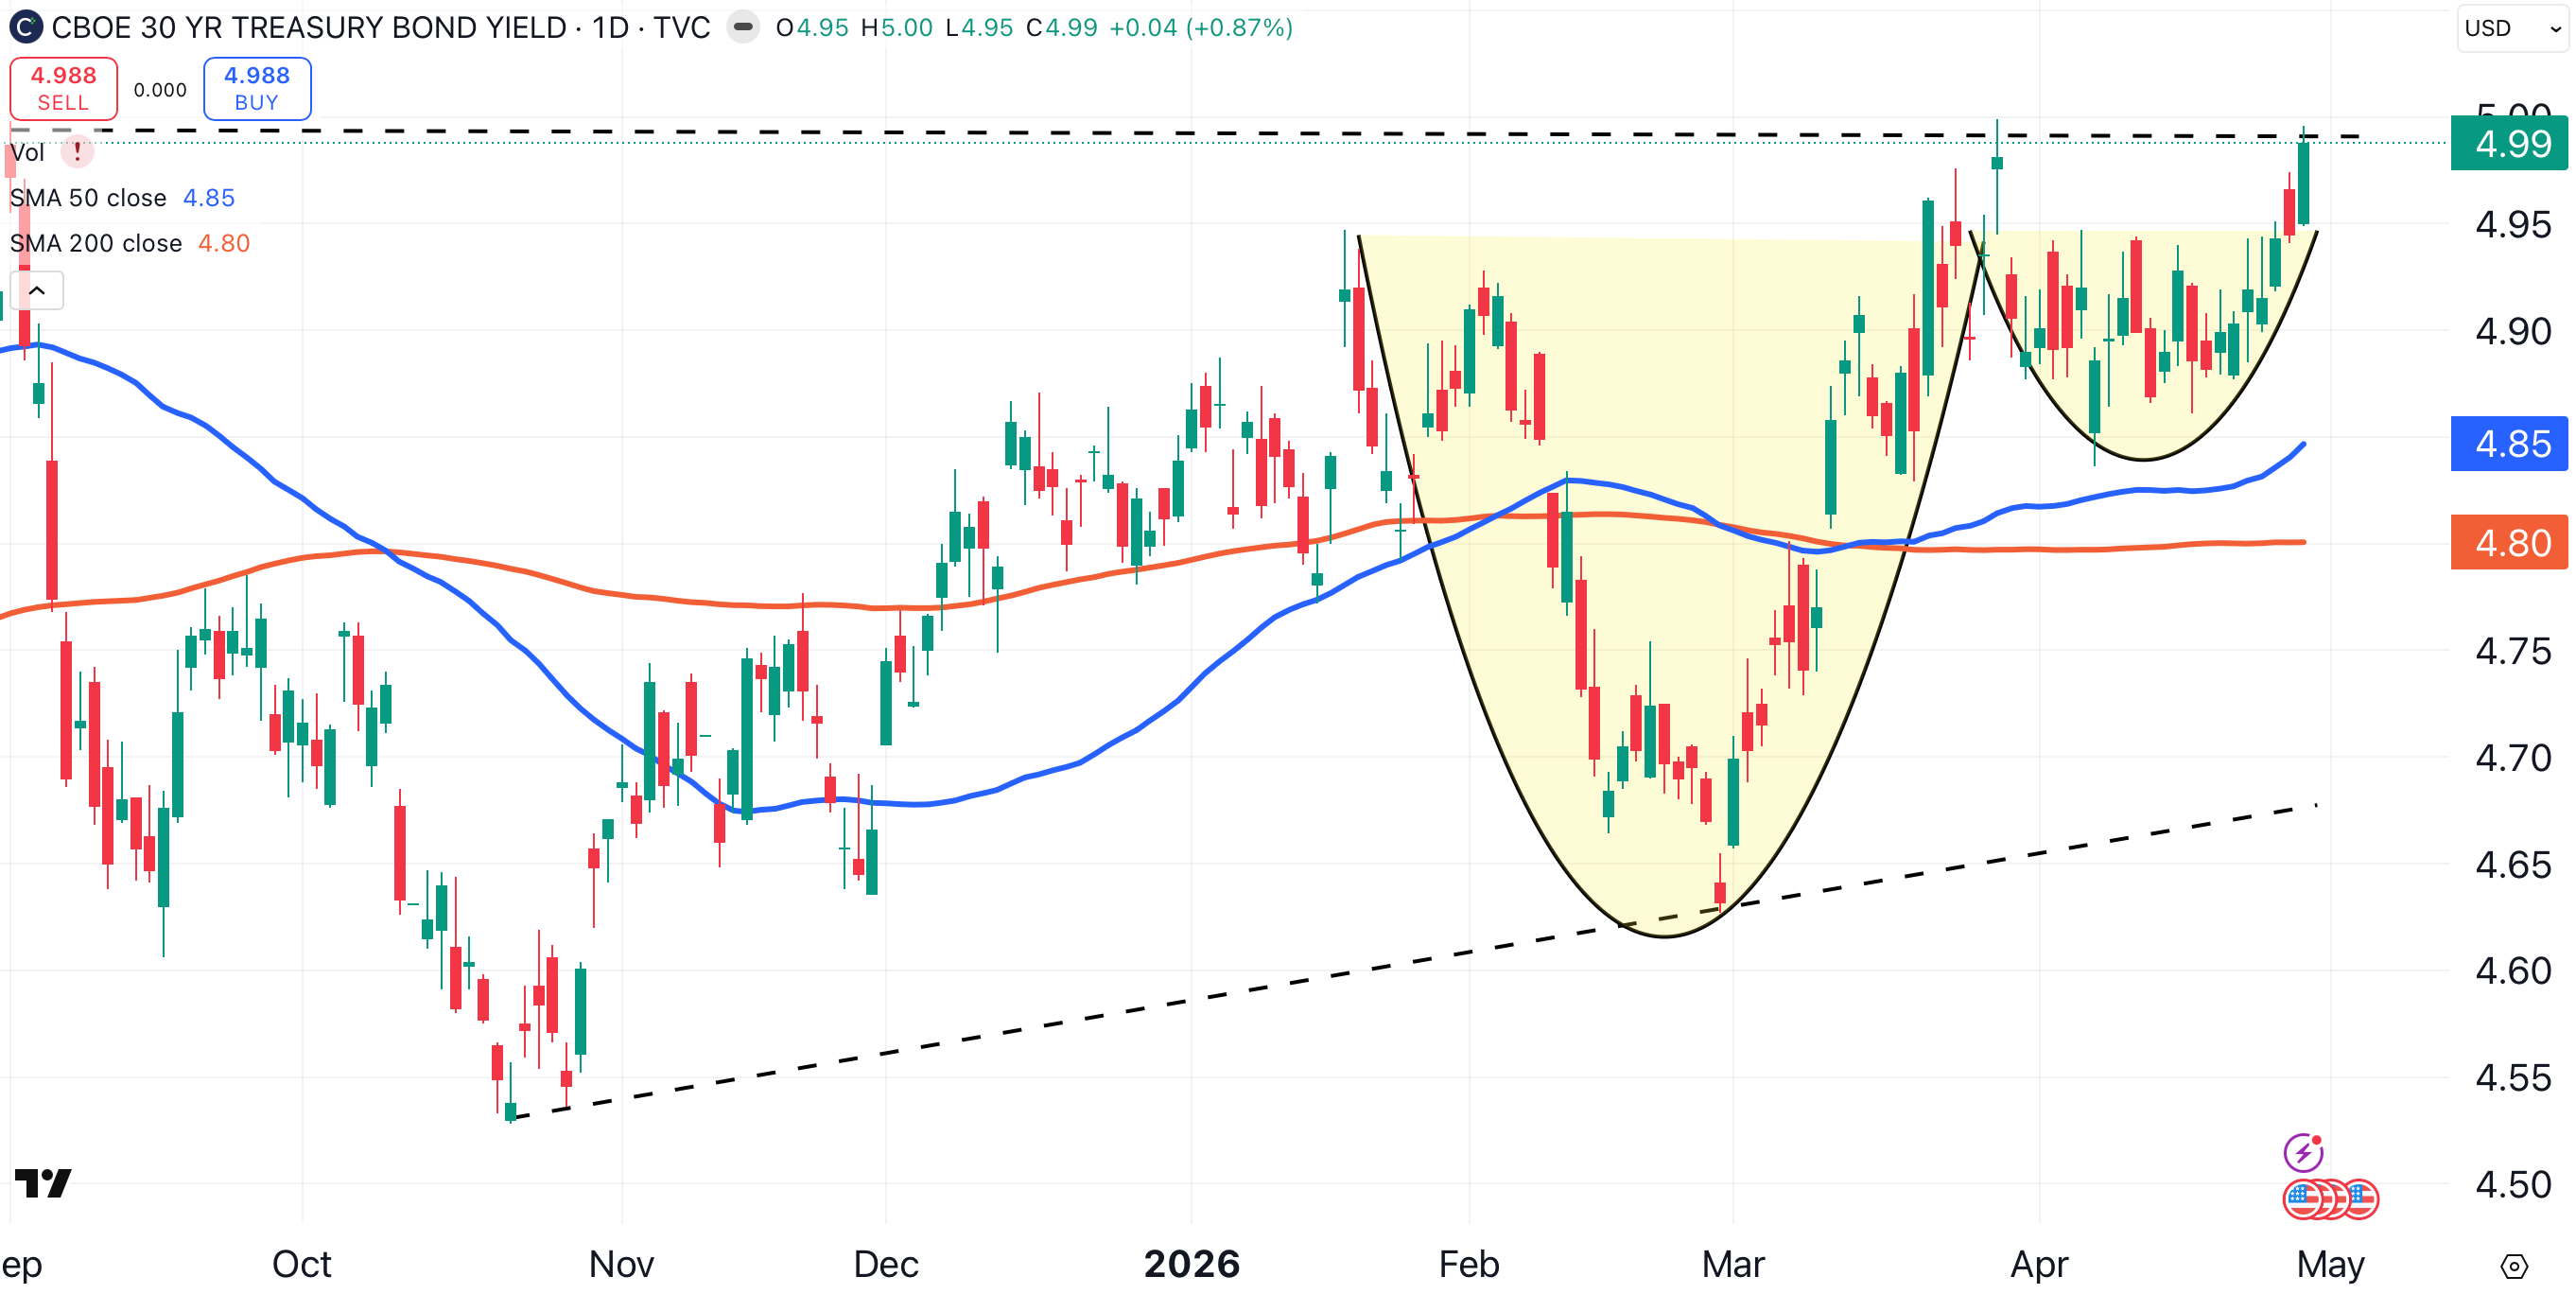
The yield on the 30-year treasury bond touched 5% on Wednesday, before pulling back.
Worse, the bond’s chart indicates that yields could move higher. The 30-year treasury bond’s yield chart has formed a bullish cup-and-handle pattern (shaded yellow).
Based on this pattern, the yield on the 30-year T-bond could reach 5.25%.
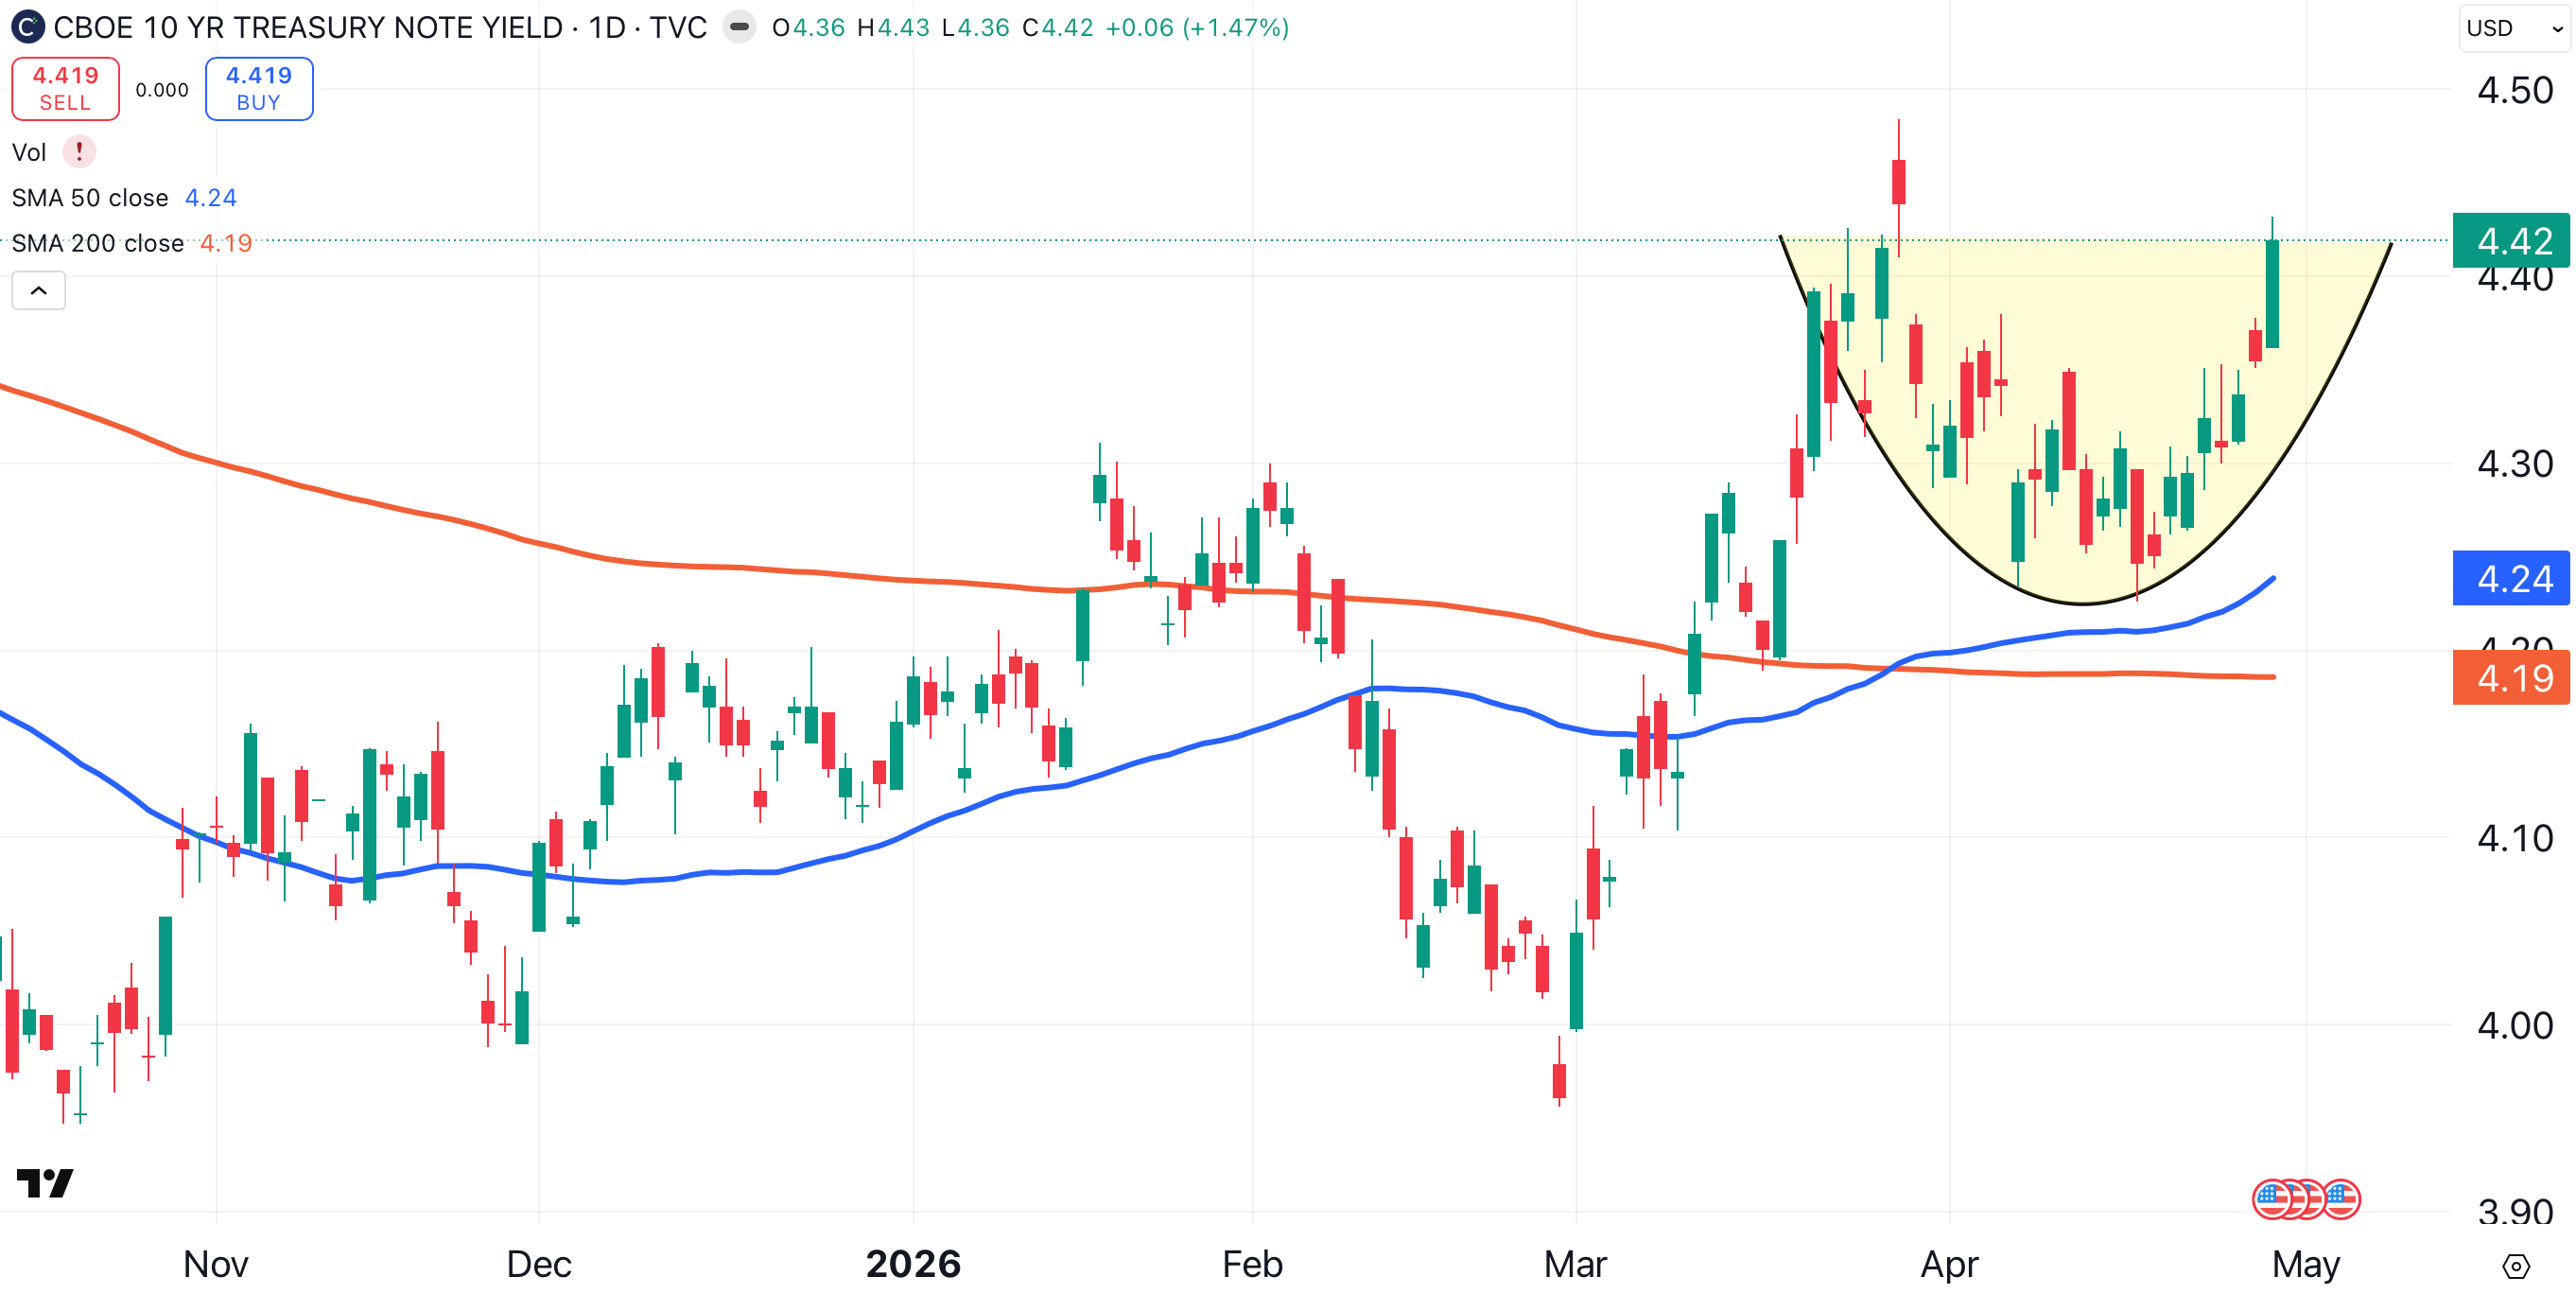
The yield on the 10-year treasury note chart also appears to be headed higher, as indicated by a rounded bottom pattern (shaded yellow). This pattern indicates that the yield on the T-note could reach 4.6%, which would represent a 52-week high.
Even the yields on shorter-term treasuries seem poised to move higher. Here we see an A-B-C-D pattern that is forming on the chart of the two-year treasury.
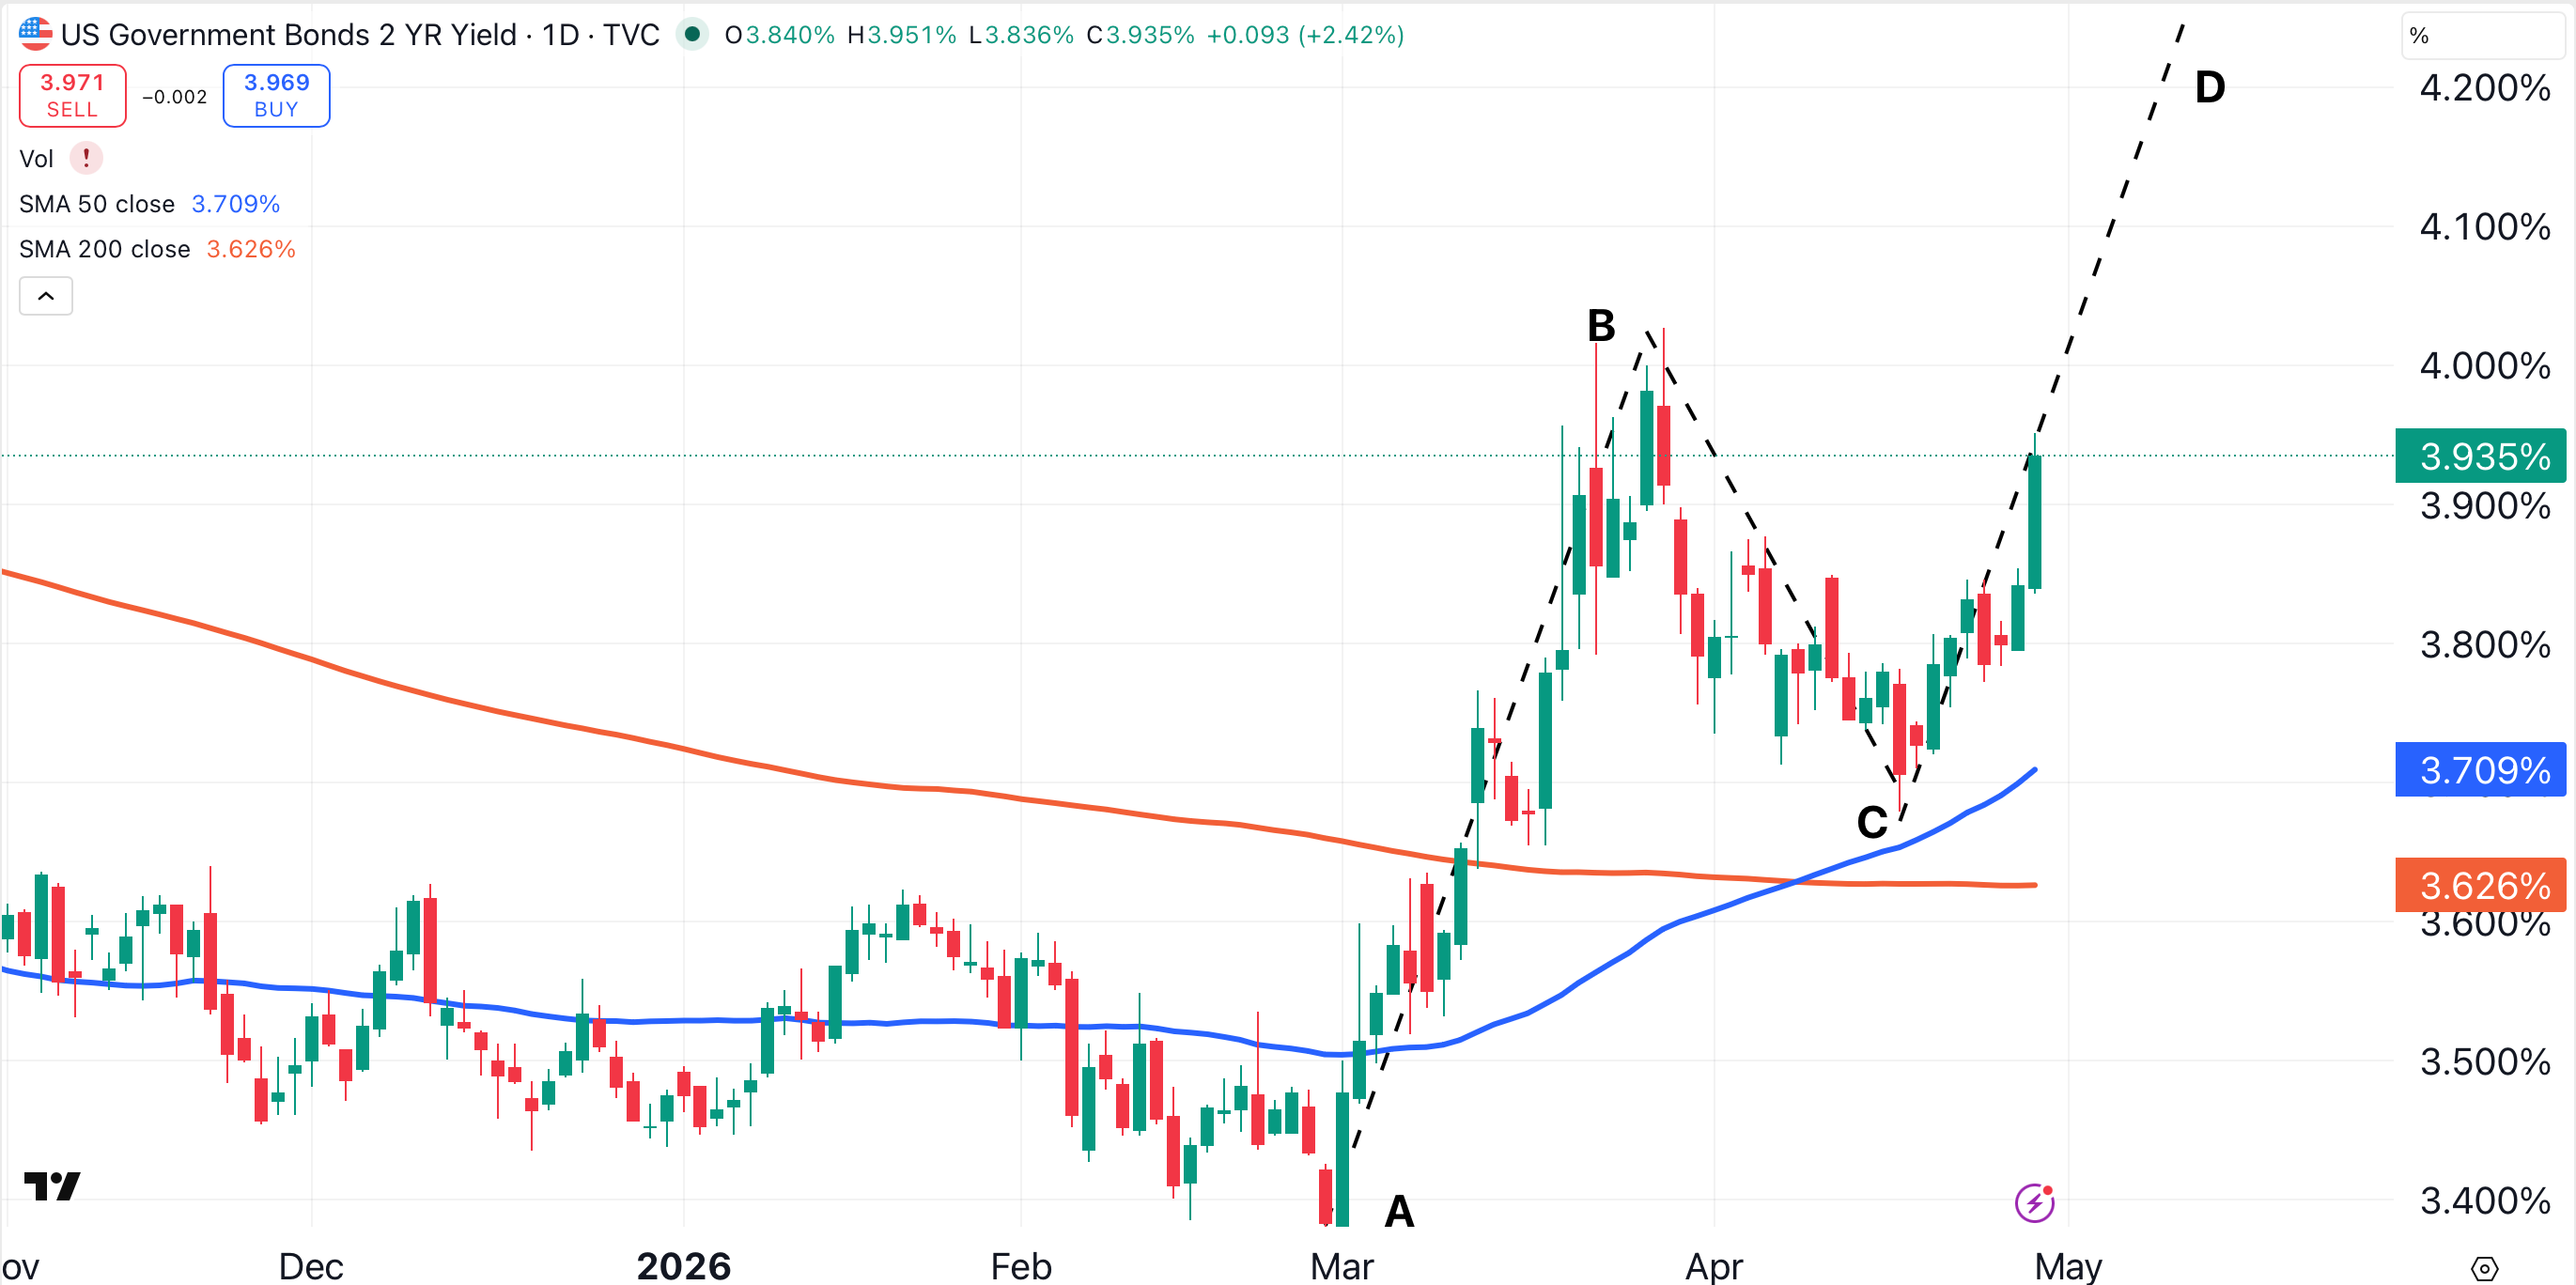
The yield on the two-year treasury is trading just below strong resistance at 4.00%. If that resistance can be broken, don’t be surprised if we see the two-year yield run to 4.25%.
Bottom Line
Powell mentioned in his post-decision commentary that Personal Consumption Expenditures (PCE) were rising at a 3.5% rate, well above the Fed’s stated target rate of 2%.
In the Q&A session, Powell was asked how his chairmanship will be remembered. He declined to answer.
Unfortunately, Powell will be remembered as a Fed chairman who misjudged inflation. He kept interest rates too low for too long, stoking the worst U.S. inflation in 40 years.
As Powell takes his final bow, is inflation about to take the stage for an encore?
Related: The Fed Isn’t Losing Control—It’s Sending a Message
