A Deep Dive Into the Sentiment Readings
Let's take a look at some of my favorite sentiment indicators. Many are at extremes; what are they telling us?
You've reached your free article limit
You've read 0 of 1 free Pro articles.
Was the turn last Thursday in the others a major shift or was it just an unwind? Was the late day sell off on Friday a shift or just the result of a short term overbought condition or something more significant?
My guess is they are both a bit of each. But today, I think we need to discuss sentiment. You see, many of the sentiment indicators are extreme. I can only think of one or two that show they are not yet extreme. Can the shift in the 493 change that?
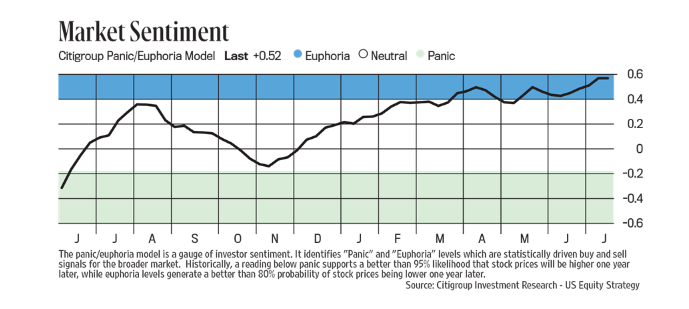
We already know the Citi Panic/Euphoria Model is in Euphoria. It has been there for months now. Last week it ticked up even higher.
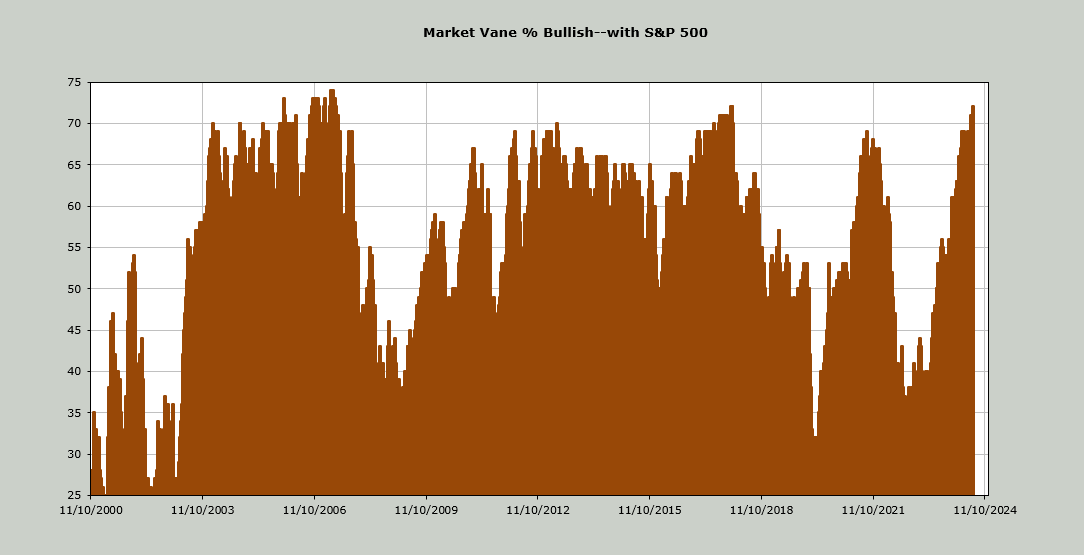
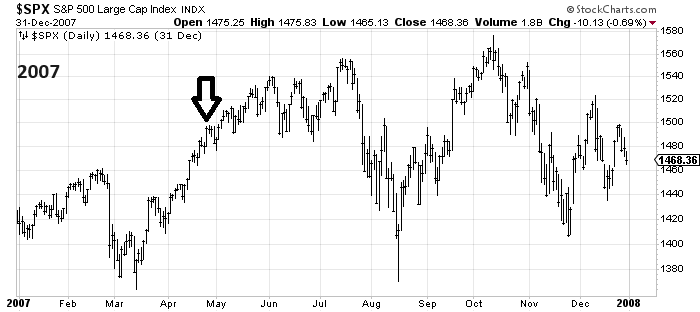
The Market Vane Bulls are now at 72. The last time we saw them up here was January 2018, which was just prior to Volmagedden in February 2018. They did reach 74 in the spring of 2007. The market actually kept going for nearly three months before the tremors began that summer. The arrow on the chart shows when we got that high reading.
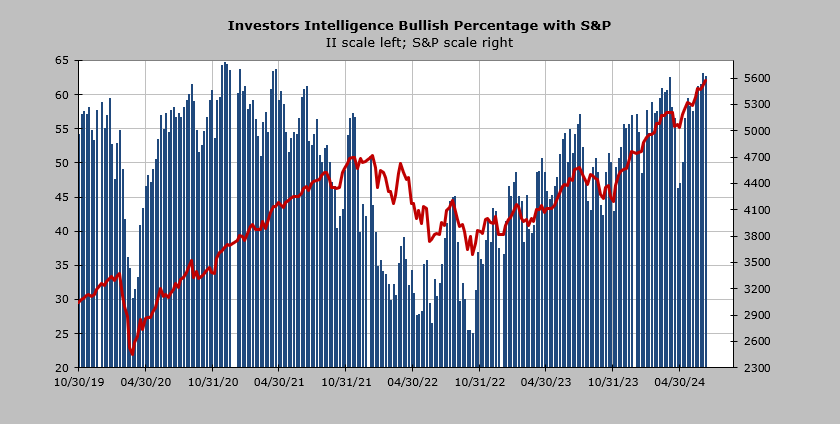
The Investors Intelligence Bulls are at 62.7%, which historically is quite high. I believe we may see this notch up when the data is released midweek this coming week. We got to just shy of 65% in December 2020. We can see, using the S&P, that the market kept on going. But we all know that the majority of stocks peaked in January 2021. We also know that the great divergence (Mega Caps taking over the indexes) began in earnest in 2021. That is when I began calling it the Either/Or market.
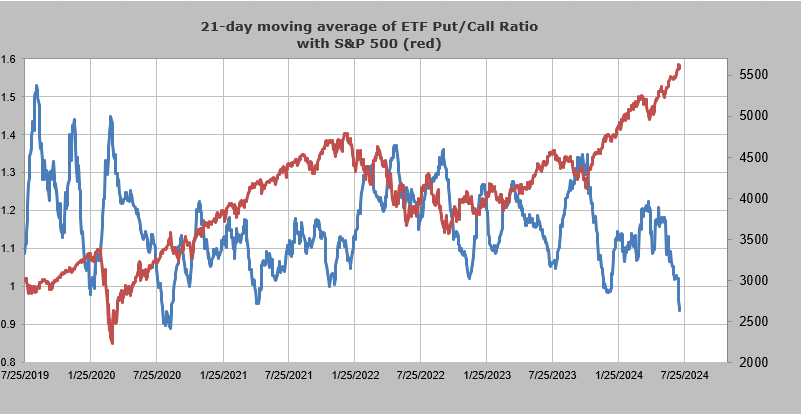
The 21-day moving average of the put/call ratio for ETFs is closing in on the level it was in late summer 2020. It looks like a blip on the chart but the S&P fell about ten percent that September.
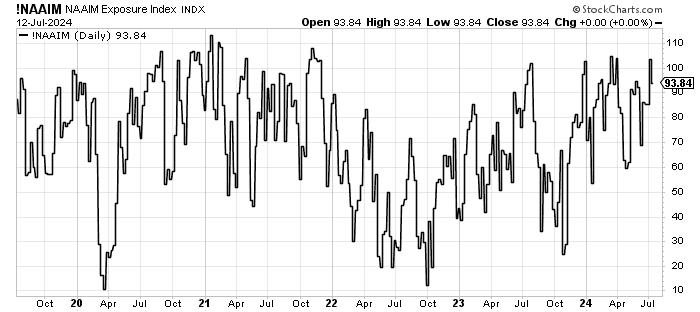
The National Association of Active Investment Managers (NAAIM) saw their exposure lift over 100 two weeks ago. Last week they bought it down to 93. We can fuss wither 93 or 103 is matters but I think we can all agree that this area is a far cry from the 25 we saw in October and thus leans extreme.
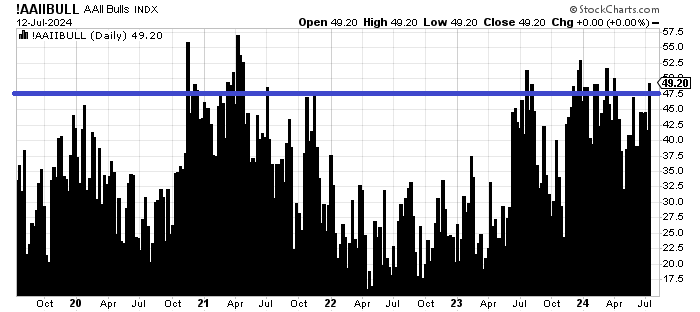
So what’s not extreme? The American Association of Individual Investors show their bulls just shy of 50%. That is not extreme, although it does reside on the high side. Their asset allocation to stocks at 71% is on the high side from a historical standpoint.
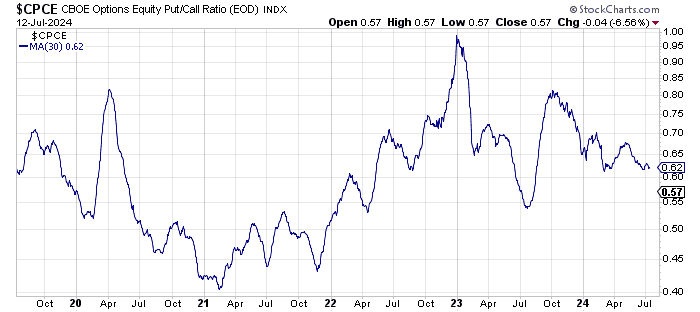
The 30 day moving average of the equity put/call ratio is also not extreme. We hear all this chatter about how many call options are being traded yet this indicator was lower in the summer of 2023. Sure it resides closer to the low end but it is not extreme.
I think what we have is complacent sentiment. I think much of that is due to the Either/Or nature of the market. It’s hard to get giddy and excited when only a handful of stocks are moving the major indexes higher. But that is the sort of market that gets folks complacent. So let’s see if the move up in the others last week can get the indicators that are not extreme into an extreme position before we reach an intermediate term overbought condition later this month.