4 Things to Note in This Market Beyond the Giant Chopfest
Let's examine what's ahead for the short and intermediate term, the McClellan Summation Index, energy, bonds, and the once-mighty cocoa.
You've reached your free article limit
You've read 0 of 1 free Pro articles.
Short term the market is overbought. I say that because seven of the last 10 trading days have seen breadth positive. Intermediate term we are closer to an oversold condition than an overbought one.
And with all of this the major indexes are trading where they were three weeks ago in mid-April. So really all we’ve gotten is one giant chop fest.
Away from that there are some things to note. The McClellan Summation Index, thanks to breadth being positive for four of the last five trading days, has turned up. You will need to use that plus sign on your screen to increase the size of the chart so that you can actually see the turn up.
The good news is that should the market head south in the next few days the Summation Index would likely stay steady or at least set itself up for a turn up on the next rally. As a reminder, this tells us what the majority of stocks are doing.
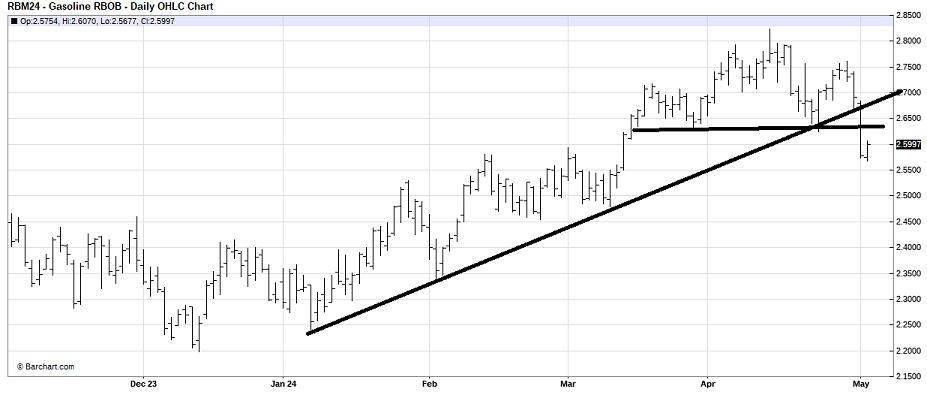
Then there is energy. I had been riding the energy train since December but got off it in early April when not only did I find myself with too much company but, as I noted to you, the VanEck Oil Services ETF OIH had begun to underperform to a great extent — and I have found that OIH, the higher beta energy trade has been a good leader.
However, I took a look at the chart of gasoline on Thursday and was surprised to see it had not only broken an uptrend line dating back to January, it also completed a (funky) head-and-shoulders top. It is funky because the right shoulder is higher than the left. In any event, that top measures to the 2.50 area. One thing we can all agree on: lower gas prices would make us all happy.
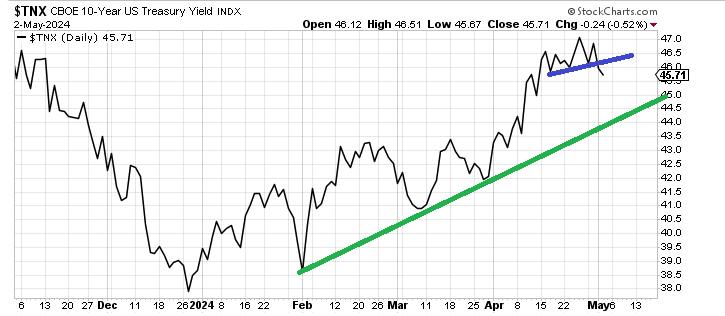
Then there are bonds. You may recall I had thought 4.65% was the top area for rates on this recent run-up. We did tag 4.70% but it didn’t last long. In fact, rates have been milling around the 4.65% area for three weeks now. On Thursday, they broke down from that tiny little top and for the first time since mid-April they are under 4.60%.
Now the Jobs report on Friday might very well take them right back up but it’s hard for me to imagine rates are going to scream higher, having broken that small support area. If rates cannot get back up and over 4.65%-ish then I think they are coming down to tag that green line in the chart below. It is currently 4.40% but as time goes on it will rise.
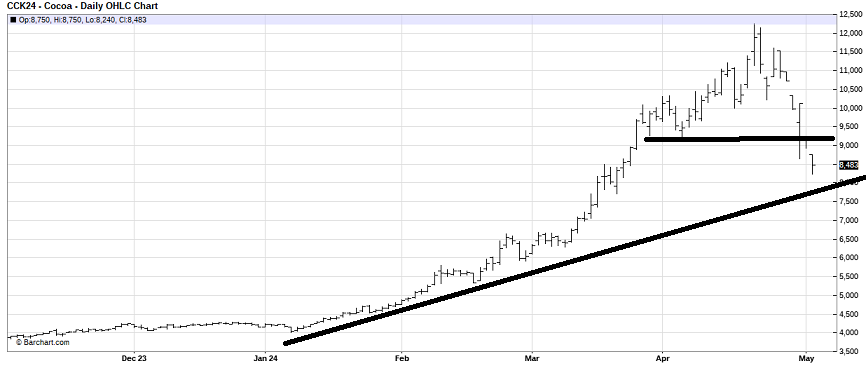
I will end with one more "inflation" chart. It’s cocoa. I have been advocating for it to come down and that it has. It is now down about 30% since mid-April. That’s probably why you have stopped hearing so much chatter on it.